Grid customization basics
8:47 minutes total learning time
Want another way of looking at things? This module for beginners covers simple methods of customizing your view in the analysis grid.
Phocas product
5 videos in this learning module
1
Gain more screen space - and other tips
1:15
2
Change your data format
1:47
3
More options for displaying data
1:15
4
Select and change periods
3:31
5
Freeze the properties column
0:59

5 videos in this learning module
1
Gain more screen space - and other tips
1:15
2
Change your data format
1:47
3
More options for displaying data
1:15
4
Select and change periods
3:31
5
Freeze the properties column
0:59
Gain more screen space - and other tips
Watch David's tips for simplying the grid and gaining some extra screen space.
Supporting documentation
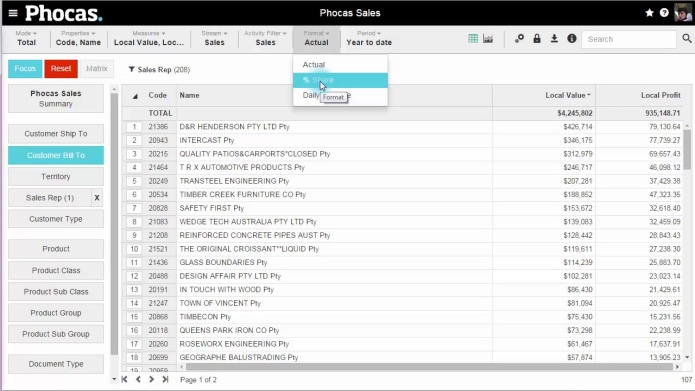
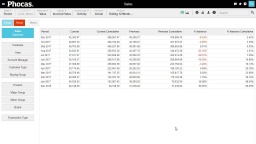
Change your data format
Learn how switching from actual figures to percentage share view can instantly reveal discrepencies between sales value and profitabilty.
Supporting documentation
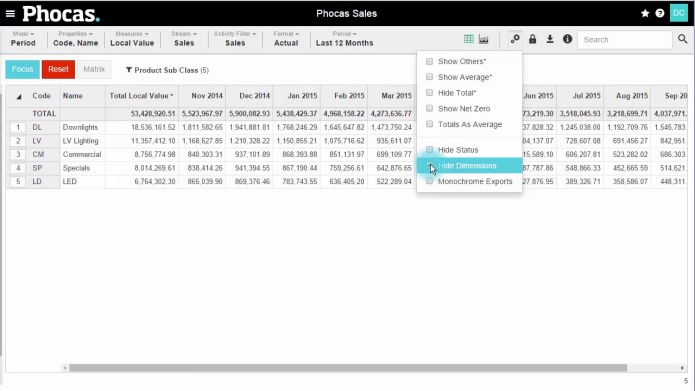
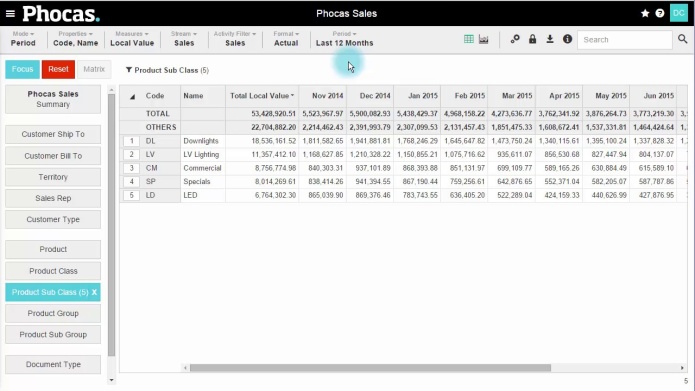
More options for displaying data
Want another way of looking at things? In this video, learn about show others, show average and hide total - one-touch features that help satisfy your curiosity by presenting your data dfferently.
Supporting documentation
Select and change periods
Learn about using periods (date ranges) in Phocas. In this video Tina shows you how to choose a pre-defined period, apply a custom period or add a defined period for your own use.
Supporting documentation
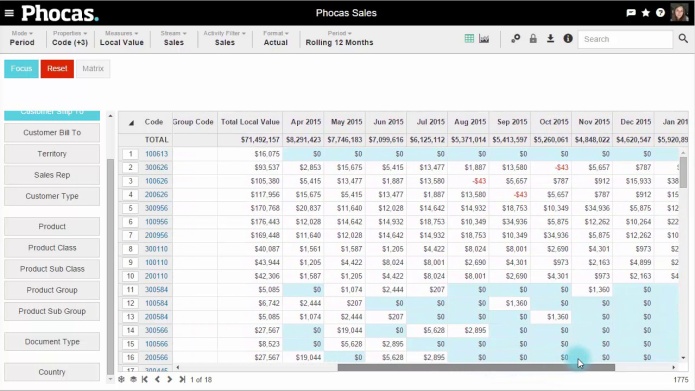
Freeze the properties column
When you have many columns on the screen, there can be lot of data to scroll through. This video shows you how to freeze properties such as name, code etc so you can scroll as much as you like without losing sight of any important reference data.
Supporting documentation
Phocas product

Related learning modules
Phocas QuickStart: Analytics
This module for beginners takes you through getting started in Phocas Analytics and doing some simple analysis to get fast results from your data. These videos introduce you to features that you will be using every day.
Choose your own date ranges
The data you see in the grid is determined by the period (or date range) you have selected. Learn about selecting, changing and creating periods in Phocas.
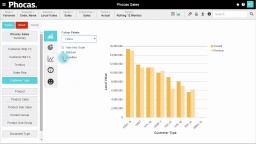
Turn data into a chart
Switching from grid to chart view opens up options for various graphical presentation of your data. This module covers basic chart setup through to advanced configuration, with a detailed look at some chart types.