Phocas Financial Statements upgrades

The Financial Statements solution was upgraded this year so your team can review and analyze financial statements directly in Phocas.The solution makes month-end financial statements more accessible and allows more people to understand the impact of operational decisions on financial performance faster.
As business intelligence and the finance function continue to converge, Phocas is committed to delivering specific new features to its products that enable the finance team to harness the power of data analytics.
By adding financial statements to Phocas business intelligence software brings active analysis, data drill down and dashboarding to the finance and management team with fully controlled user-permission.
Phocas Financial Statements sits as a presentation layer on top of the ERP data. Financial statements are created in the same tradition as the accounting team recognizes, but the process is automated for each statement. The finance team can quickly build financial statements customized to users’ access, so branch managers can see information relevant to their branch, and management can see information across the whole business. The statements can also sit across one or many ERPs so leaders can view the individual company, branch, regional performance and even the consolidated performance when required.
Active analysis
Now that preparing the financial statements is faster and simpler, the finance team has time to carry out in-depth analysis of the numbers. By preparing financial statements within a data analytics environment, you can quickly compare statements from one traditional period or outside of these timeframes - say one week to the next.
You can also monitor Gross Profit, Operating Profit and Net Profit in the Income Statement or P&L. You can review the changes or the improvement in the profitability over the whole business or by branch and uncover what's affecting the drop or increase in profitability.
For many mid-market businesses, there is the ongoing need to run leaner, markets are consolidating and more competitive. It’s the real margins and the real profitability that matters to business owners and shareholders. The data behind a decision provides the evidence for people to make a change – finance teams need the support of technology to meet expectations, drive efficiencies and add value.
Data drill down
One of the biggest issues with static financial reports is when people have questions about the numbers, they have to go back to the finance team who need to investigate further and generate more static reports.
Given the amount of time that this takes and the delays in the feedback loop that result - a level of complacency kicks in, where it is often easier not to ask the questions – which becomes the real problem.
Financial data can no longer be siloed in business – the finance team needs to utilize technology to share the reports so they can free up their time to educate the rest of the company about the actual numbers. People across the business should understand the numbers so they can better serve customers or address inefficiencies in production or warehousing themselves by drilling down into the data.
Financial dashboards
The financial dashboard is a means to communicate financial data data more efficiently. Using dashboards from the analytics tool means people can visualize financial information. This provides a clear and real snapshot of your business and is a more natural way to uncover patterns, communicate insights, and make data-driven decisions. More visibility of financial performance through dashboards leads to better conversations between teams by having an easier way to understand the financial statements. A graph seems like fewer numbers than a financial statement. By using dashboards, more people grasp the numbers, which leads to an organic education of non-financial stakeholders and a stronger performing business.
Check out our ultimate guide to financial software, budgeting and forecasting
PDF export with scaling, headers & footers
What the Phocas solution has concentrated on is removing the limitations of Excel and used the power of the data analytics solution to carry out data consolidation, analysis and customization, so the preparation of the financial statements is straightforward and replicated quickly and efficiently.
Phocas financial statements are also designed to work with Excel and have an extension into it, as required. When exporting to Excel, all Phocas hierarchy's are maintained, and formulas remain intact for seamless integration enabling additional modelling such as cash flow forecasting. The financial statement can also be exported as a PDF.
Phocas is all about analysis, whereas financial statements are traditionally about presenting static financial data in the way accountants want to see it. Phocas allows you to blend financial statement with analysis, this makes Phocas incredibly powerful.

Empowering businesses with intuitive data analytics, driving informed decisions for growth and profitability. We make people feel good about data.

When to use an operating budget for more detailed planning
What is an operating budget? An operating budget is a resourceful tool that enables businesses to estimate income projections and expected expenses and plan for low-earning or high-spending months. This financial plan provides data that constantly records the costs of your business operations for a specific period (mainly up to the end of the year). It also serves as an outline detailing how much money a company spends and incurring expenses.
Read more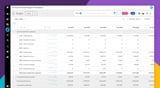
Best practices for cash flow forecasting
Whether you are managing inventory or planning an acquisition, to maintain day-to-day operations you need a clear cash flow forecasting process. Staying on top of cashflow means you can gauge your solvency and profitability from a long and short-term perspective.
Read more
Improve planning with comprehensive sales forecasting
If the owner of your business wants to expand to a new State, would you have the sales forecasting figures to know whether the business can afford to do that or not? Or, if you had to produce a 3–year solvency projection for the CEO, is your sales forecasting process robust enough to support a reliable analysis?
Read more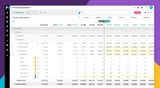
What is financial modeling and common models to know
Predicting the future is a daunting task, unless you possess a time machine like Marty McFly in the 1985 film, 'Back to the Future'. If you don’t have such a tool, the next best thing is financial modeling. It can offer valuable insights and guidance into the future financial position of your business.
Read more
Find out how our platform gives you the visibility you need to get more done.
Get your demo today