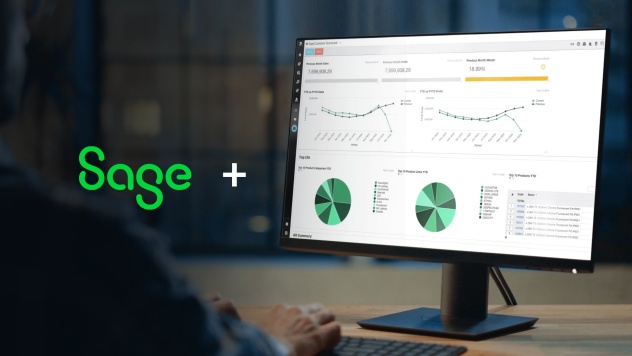
Sage analytics and reporting made easy
Phocas pulls Sage data and multiple other sources into a centralized platform for in-depth analysis and flexible reporting.
Quick, obligation free
Take a peek at how Sage + Phocas works
Made for Sage
- Sage 50
- Sage 100 CRE
- Sage 200
- Sage 300 CRE
- Sage Intacct
- Sage X3
Find out how to make your Sage data work harder with Phocas.
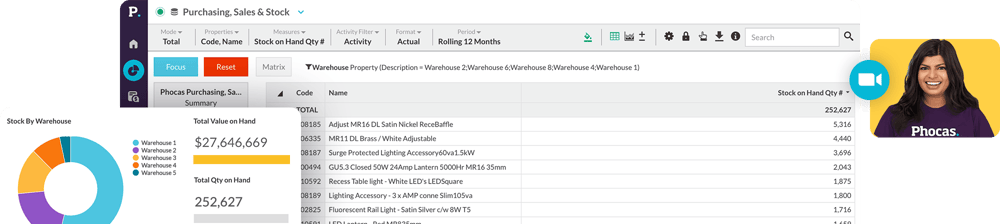
All your data in one place
- Consolidate financial and operational data so everyone is connected to the same numbers.
- Empower everyone to drill into data and compare data sets so you can gain greater insights and make better business decisions.
- Increase visibility over large amounts of data so you can find answers to previously unsolved questions.
Empower everyone to do more
"It’s very rewarding to be able to give staff and teams access to data that they can understand and drill themselves."
Tim Barr, Head of Finance - Woodberry
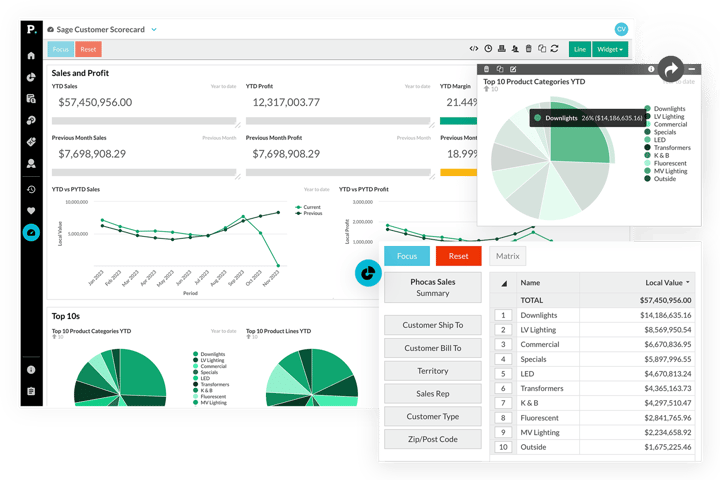
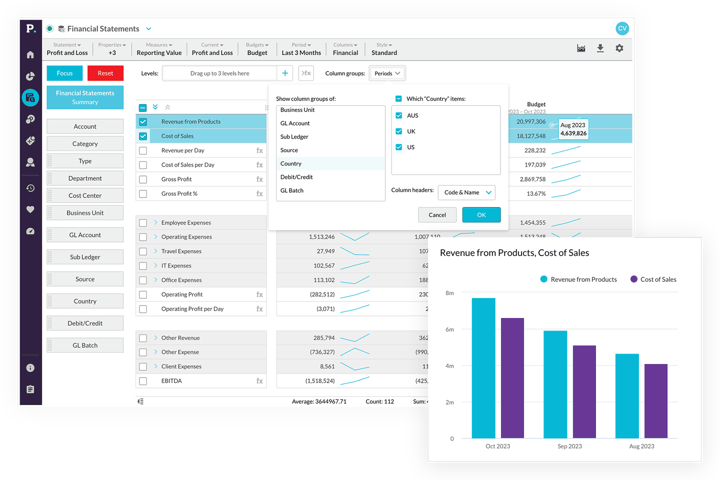
Extend Sage reporting functionality
- Don’t wait for IT to build reports - save time with a human-friendly reporting solution that lets you build and customize new reports and dashboards.
- Reporting automation means everyone has the information they need with no data chasing.
- Loading times are fast, regardless of transactional data volume.
- Additional reports and dashboards are included in the pricing so you won’t experience escalating costs.
- Reports can be quickly presented in easy-to-understand layouts such as a graphs, charts and dashboards.
— Rodney Macnamara, General Manager at Abcoe Distributor.
Sage + Phocas customer
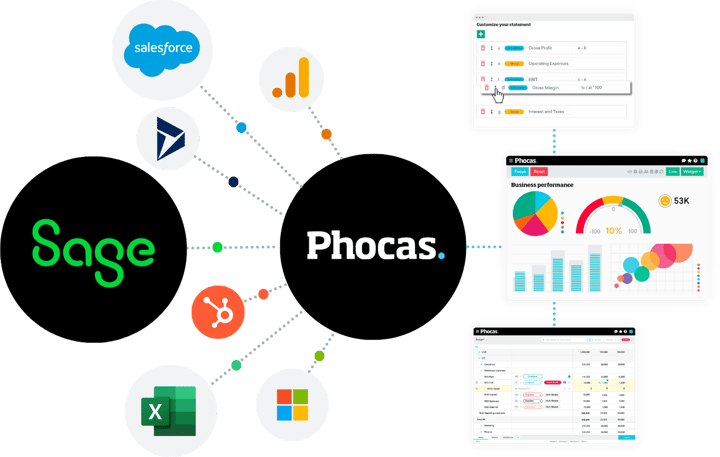
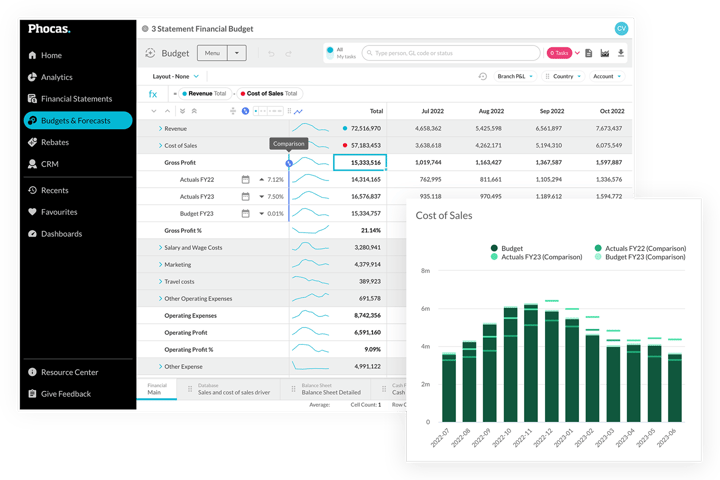
Freely explore all your data
- The Grid, a unique ad-hoc analysis layer, enables teams (including sales, inventory, purchasing) to perform free-form analysis.
- Drill down from high-level views like dashboards down to cost centre, GL code and transactional-level data.
- Protect sensitive information with data access and security defined at an employee level.
- Create and save reports, alerts and dashboards relevant to your role so you can instantly answer questions.
Phocas powers thousands of data-driven companies worldwide
No more software hunting
- As your business grows, Sage + Phocas covers everything: BI Analytics, Financial Statements, Budgets and Forecasts, Rebates
- No need to purchase all platform products together, simply choose what you need now and add more when you need them
— Beth Purdue, Marketing Manager at Woodberry.
Sage + Phocas customer
Fast implementation, full support
Frequently asked questions
Phocas is a business planning and analytics platform while Sage ERP systems are designed to manage various aspects of business operations. When integrated, Phocas enables companies to manage their operations more effectively in a various ways, such as:
- Powerful business intelligence analytics - Phocas collects and consolidates huge amounts of data from multiple business sources, empowering Sage ERP users with fast, easy access to real-time data within one platform source.
- Custom reporting - Reports and dashboards are customizable to meet specific business needs and can be created by all users. Insights and metrics that may not be readily available in standard Sage ERP reporting tools can be extracted with ease. Design your own reports that offer a deeper understanding of business performance.
- In-depth analytics - a unique ad hoc analysis layer, The Grid, enables all users to perform in-depth analysis. Drill down to transactional level and pivot the data in multiple ways such as by customer, branch, product or region.
- High performance - By integrating your Sage ERP with Phocas, you'll achieve lightening fast loading times, regardless of the volume of transactional data stored.
- Companywide adoption - a user-friendly interface enables users across all departments to access and analyze their own data, not just IT experts or data analysts. Enhancing collaboration and fast decisions-making.
- All-in-one platform - Along with a BI Analytics foundation, Phocas offers comprehensive financial planning products that work together smoothly, including Financial Statements, Budgets and Forecasts, and Rebates.
Yes - Phocas specializes in combining business data, most often ERP and financial data, with other non financial data sources. Providing one trusted platform to measure, track and plan your ongoing business operations quickly and easily.
Phocas started as a BI solution, so we understand the ins and outs of data manipulation. Our customers loved the enhanced capabilities that Phocas brought to their ERP that they started asking for financial analysis and budgeting and forecasting capabilities too.
Our focus is creating software and tools that anyone in your organization can use to understand sales, operations and logistics, making sure that your team can plan and forecast based on a solid foundation of trustworthy data.
Data analytics, or business intelligence (BI), is the process of interpreting key business data to understand how an organization is performing, both financially and operationally.
Data analytics software is designed to retrieve, analyze, transform, and report on business data and metrics. This software provides organizations with an integrated view of their overall business by combining multiple data sets, such as enterprise resource planning (ERP) systems, CRM, HR, Payroll and e-commerce. BI can also be used to identify trends, uncover insights, and make informed business decisions.
This is the process by which businesses regularly plan, review and control their finances.
The budget is a company's financial plan of intent for 12-months. This will incorporate data from finance, operations, sales, inventory and other company information to enable them to set goals and to monitor and manage their finances.
The forecast is a more detailed financial plan for a set amount of time, such as the last 6 or 3 months of the financial year.
Budget forecasting is when businesses regularly track actual performance numbers and compare them to the budget. Any insights or risks gleamed from this assessment can then be used to re-forecast the remainder of the budget period. This way, potential issues can be mitigated before they become a major risk, or swift action can be taken when responding to rapid economic or environmental change.
When you’re armed with this information in real-time, you have more control of your financial position throughout the year. It also enables you to take take action to avoid greater risks in the long term, while at the same time helping you to achieve your business goals.
Financial statement software is a program designed to automate the process of creating reports such as profit and loss (income statement), balance sheet and cashflow statements. It achieves this through the extraction of real-time data from ERP, CRM and multiple other data sources, and helps to ensure accuracy, consistency, and compliance with accounting standards.
Statements are fully customizable to suit your business needs with an intuitive interface that enables free-form data analysis. Visualizations such as dashboards, graphs, charts and Sparklines also help to connect the wider business to performance as it's easy to provide an at-a-glance view of your finances.
There are several benefits of using financial data analysis platform over Excel or other manual reporting methods:
-
Time-saving: It frees up the finance team from time-consuming reporting tasks by automating entire processes, allowing for faster reporting, consolidation, and customization.
-
Accuracy: Data is pulled directly into the platform which ensures accuracy and reduces the risk of errors that can occur when maintaining and reworking static spreadsheets.
-
Standardization: It enforces standardization across financial statements, budgets and reports to ensure consistency and enables comparisons across different periods.
-
Collaboration: It enables teams to collaborate and work simultaneously in a secure and auditable environment. This can improve communication and reduce the risk of data discrepancies.
-
Reporting: It provides advanced reporting capabilities, such as customizable templates and interactive dashboards. This makes it easier to visualize data and identify patterns and trends.
-
Security: It provides better security features than Excel, including data encryption, user access controls, and audit trails. This can help protect sensitive financial data from unauthorized access or modification.
- Customizable: You can add calculations to the statements such as EBIT, margins and ratios
While Excel can be a useful financial reporting tool, a complete platform of analysis, financial statement budgeting and forecasting, and rebates tools can help businesses streamline their financial reporting processes, improve accuracy, and make better, faster decisions based on real-time data.
Loved by customers
Source: The BI & Analytics Survey 23, BARC