Sage + Phocas
Boost Sage reporting and analytics
Are you tired of manually handling ERP data and struggling to run reports? With Phocas, all data is pulled together into one platform. It's fast, accurate and completely self-serve for all users.
4.8/5 on Capterra
4.6/5 on G2

Take a peek at how Sage + Phocas works
A Sage compatible solution
As a certified Sage tech partner, Phocas has been seamlessly integrating with Sage ERPs for many years. We assess your business needs upfront to ensure Phocas is the right fit, paving the way for a fast return on investment. Our dedicated implementation team handles all the heavy lifting, achieving in a matter of weeks what can take other providers 1 - 2 years (and beyond) to complete.
- Sage 100 CRE
- Sage 200
- Sage 300 CRE
- Sage X3

Up-to-date data across all systems
- Automated: Sage + other data sources are pulled into one central platform
- Accurate: Up-to-date data flows across reports, dashboards, financial statements, budgets, forecasts, rebates
- Reliable: Phocas handles big data volumes while maintaining fast, reliable performance
- Secure: Sensitive information is protected with employee-level data access and security.

Customer quote
“Previously we were dragging individual reports on customers and products by state or sales rep out of Sage. It was really complicated and time consuming, taking hours to extract, manipulate and massage in Excel. With Phocas, your whole business opens up at the click of a button!"
— Gary Gill, General Manager at SpanSet.
Sage + Phocas customer
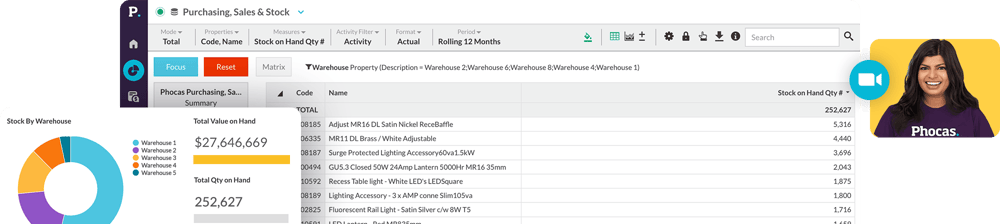
Self-serve Sage reports
- Self-serve: Reports and dashboards can be built and customized in minutes; from scratch or using pre-built templates
- KPIs: Report on metrics relevant to your department, save as favourites and set up ongoing alerts
- Granular visibility: Drill down to transactional-level data by branch, division, sales rep, product, customer and gain instant answers
- Phocas AI: Fast-track data analysis for new users
- Time & cost: Self-serve reporting prevents a backlog of requests to IT and Finance, and avoids escalating consultant costs.
Sage + Phocas customer
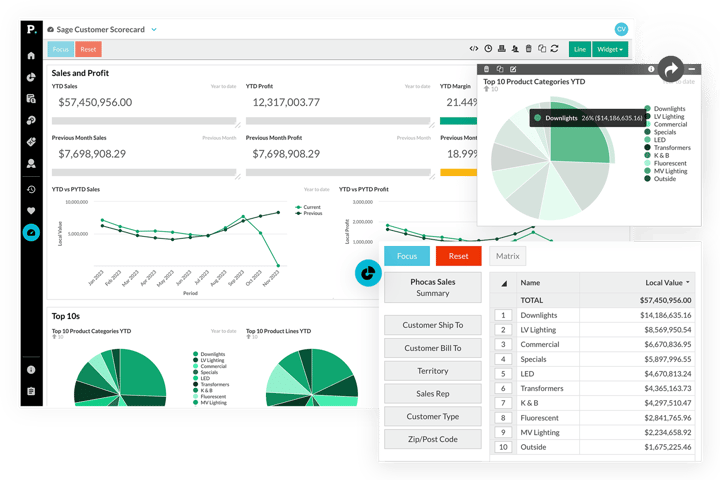
Empower everyone to do more
"It’s very rewarding to be able to give staff and teams access to data that they can understand and drill themselves."
Tim Barr, Head of Finance - Woodberry

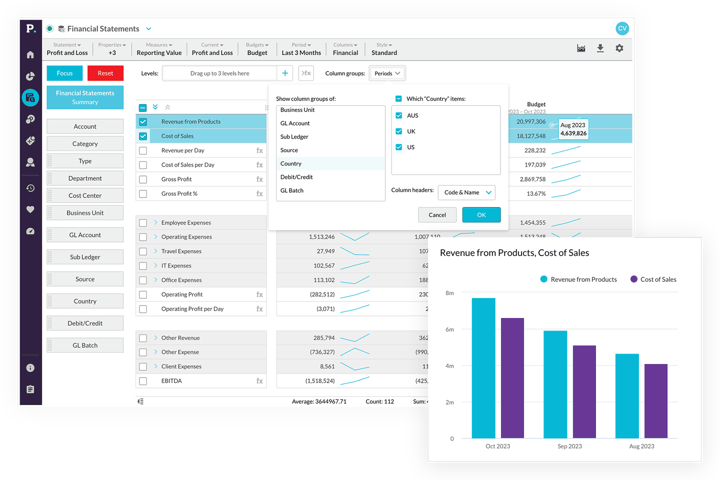
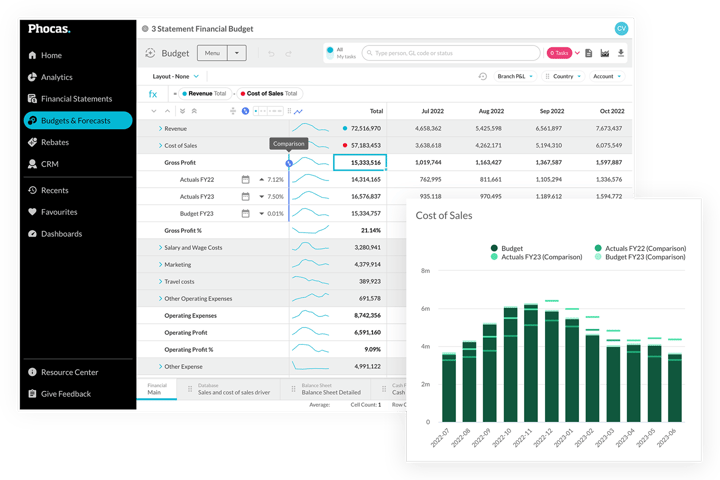
Sage financial planning
- Fast: A flexible, custom-built budgeting tool that's as user-friendly as a spreadsheet
- Automated: Up-to-date financial and operational data feeds budgets and forecasts so actuals are always reliable
- Collaborative: Assignment, submission and approval processes make cross-functional input quick and painless
- Easy tracking: Live actuals allow you to track progress, compare to planned performance and visualize results
- Cashflow: Use the budget model to create a three-way forecast that automatically syncs with your Sage ERP
Customer quote
Phocas is definitely easy to use, and our team don't have to rely on the central office to get the reporting they need. The biggest benefit, however, is the flexibility to drill down to the next level of data and set up standard ways to look at things. It just makes life easier."
— Rodney Macnamara, General Manager at Abcoe Distributor.
Sage + Phocas customer
Phocas powers thousands of data-driven companies worldwide
 Henry Schein
 Bunzl Industrial Safety
 Thermo Fisher Scientific Australia
 Husqvarna Construction Products
 Johnstone Supply
 Stark Group
 Gazman
 WD-40
WD-40- Monument Tools

- Becker Electric Supply

 Steiner Electric
 Guest Supply Sysco
 Seasol
 Sistema
 KYB
KYB Triton
 TJM Australia
 Nassco
 Baylis & Harding
 Morelli Group
 DMK
DMK Flournoy
BI and FP&A together
- As your business grows, Sage + Phocas covers everything: BI Analytics, Financial Statements, Budgets and Forecasts, Rebates
- No need to purchase all platform products together, simply choose what you need now and add more when you need them
An award-winning Sage partner
Based on 270+ customer reviews


Understand the past, operate better today, and plan well for the future
Whether you want to get your data organized for your team or you’re looking to combine business intelligence capabilities with financial reporting, planning and forecasting… We can help.
Get a demo