Tell your data story in seconds
Clearly show the data that drives business decisions
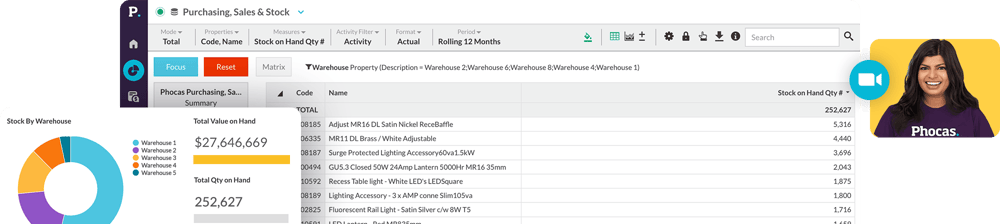
The key to managing your data’s complexity is simplifying the analytics and data discovery process. Funneling all your metrics into a centralized platform and creating easy-to-understand data visualizations is essential when dealing with vast amounts of information.
Self service
Pinpoint business-changing opportunities
When you drill down into the data underlying the dashboard, it becomes easy to ask questions in the moment — and answer them in real-time. Slice and dice the data to follow your train of thought and get the answers you need on the fly.

Automate reporting
Accessible, accurate, fast
When you have all business data centralized in one analytics platform, along with the ability to set up automated alerts and reports, delivering your findings is so much simpler. Clearly show your insights using a dashboard that provides at-a-glance clarity. Send it directly to the intended inbox or tag the right people or teams within the Phocas platform. Easing the reporting burden and ensuring teams are proactive when it comes to opportunities or risks.

Human-friendly BI dashboards
Build the view you want to see by customizing dashboards to suit your needs. Include any data and visual analytics, then revise as you see fit — all without the help of IT.
Shareable
Insights can lead to impactful change when communicated to the right teams. Easily collaborate with others by creating favorites, saving queries and “@” mentioning team members. You can also apply permissions to ensure only the relevant people are viewing certain data.
Easy to understand
With so much important information in one comprehensive, graphical view, your business will wonder how it was possible to clearly view, understand and make better decisions before dashboards.
Understand the past, operate better today, and plan well for the future
Whether you want to get your data organized for your team or you’re looking to combine business intelligence capabilities with financial reporting, planning and forecasting… We can help.
Get a demo