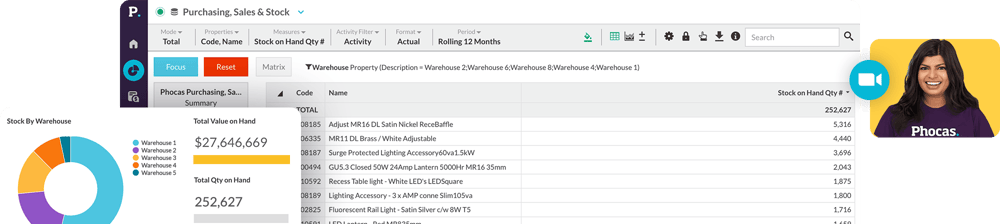
Easy storytelling with powerful data visualization

Interactive data visualizations
Build a true picture of your business
When you’re manually connecting business data from multiple sources, finding the “so what?” can be challenging. Creating shareable dashboards and interactive charts with drag and drop functionality empowers everyone to access and view the data they need.

A-ha! moments
Arrive at business-changing insights
The real benefit of being able to visualize and interact with your company’s critical information is arriving at insights that will improve your data driven decision making. Helping you answer key questions such as: why are sales trending down? What’s my fast-moving inventory?

Analyze underlying data
Explore, pivot and drill-down
Quickly jump from visualizations to data analysis: slice and dice metrics any way you like, asking and answering questions on the fly. With all of your data pulled into a single analytics tool, creating easy-to-understand plots and bar charts is essential when dealing with large data sets.

Flexible
Instantly visualize data by choosing from a variety of charts and graphs that suit your needs, including pie charts, bar graphs, line graphs, bubble charts, gauges, pareto charts, tables and waterfall charts.
Shareable
The insights from your data are even more impactful when they’re shared with others. With visualizations that are easy to build on your own, and even easier to share, you can embed them in a dashboard or scorecard, share them with individuals or teams within Phocas, or send directly via email.
All your data together
Connect everyone to the same numbers and improve understanding of business performance with data connectors for all your key sources: ERP, CRM, inventory management, Payroll, HR. Create one holistic, up-to-date view that instantly benefits everyone.
Understand the past, operate better today, and plan well for the future
Whether you want to get your data organized for your team or you’re looking to combine business intelligence capabilities with financial reporting, planning and forecasting… We can help.
Get a demo