Connect your data and your people with Phocas
All your data in one place
Streamline the way you manage sales and inventory, track financials and control your budget.
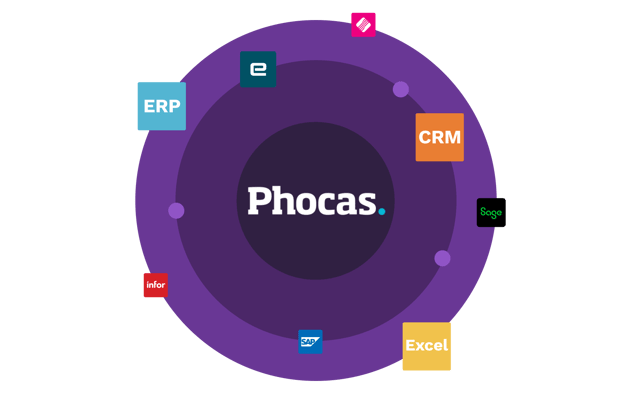
- A cloud-based solution that integrates with over 200 data sources - not limited to specific ERPs, MRPs, finance systems or CRMs.
- Consolidate financial and operational information so sales and operations are connected to the same numbers.
- Navigate, deep dive and compare different data sets together to deliver greater business insights across your organization.
- Gain visibility over a large amount of data allowing you to tackle questions and deliver solutions.
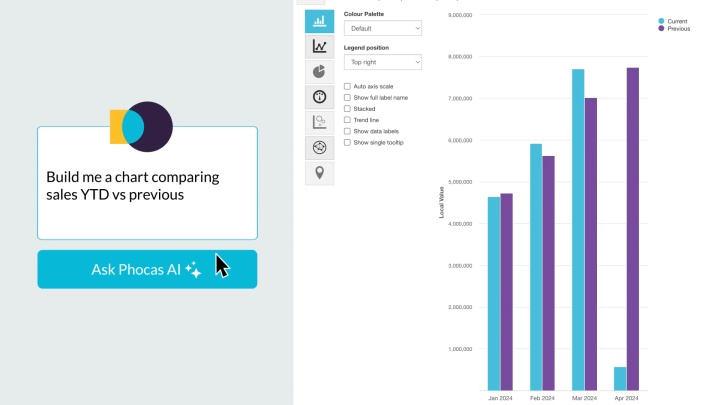
Trusted AI built into Phocas
Securely connected to your business data, helping manufacturers and distributors get faster answers, make better calls and create more value.
- Type in a quick question, and get instant answers about customers, products or sales.
- Finance, sales, purchasing, inventory teams can tap into insights fast - even people with limited experience - at every level of your business.
- Phocas AI shows the steps taken to answer queries, meaning no more guess work, just clear results.
Analytics in action: Take a video tour
See Analytics put to work through a series of short videos. Highlighting common pain points and the specific solutions Phocas delivers.
-

Quick and easy access to data
Learn how you can get quick and easy access to the information you need to make data-driven decisions with trusted data that’s pulled fresh from your ERP. -

Self-serve reports and alerts
Break-free of the cycle of back-and-forth report requests and revisions with IT. Take a look at how easy it is to set up reports and alerts in Phocas. -

Drill down and follow your train of thought
Learn how Phocas lets you drill into your data to get super-fast answers and understand what is happening and why. -

Identify opportunities to grow sales
See how Phocas can grow sales by helping your reps quickly identify easy wins, such as cross-sell opportunities in a few clicks. -

Track profitability of sales
With Phocas you can easily track the actual margins you’re making and identify customers who may be less profitable than they first appear. -

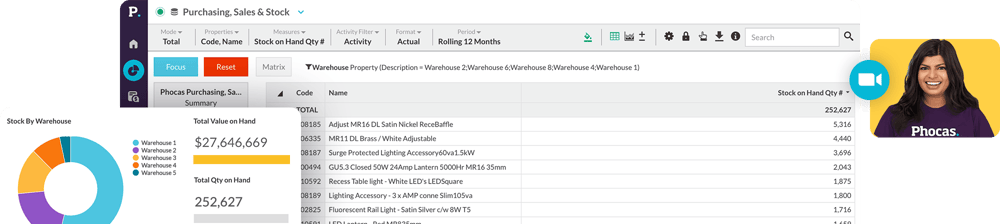
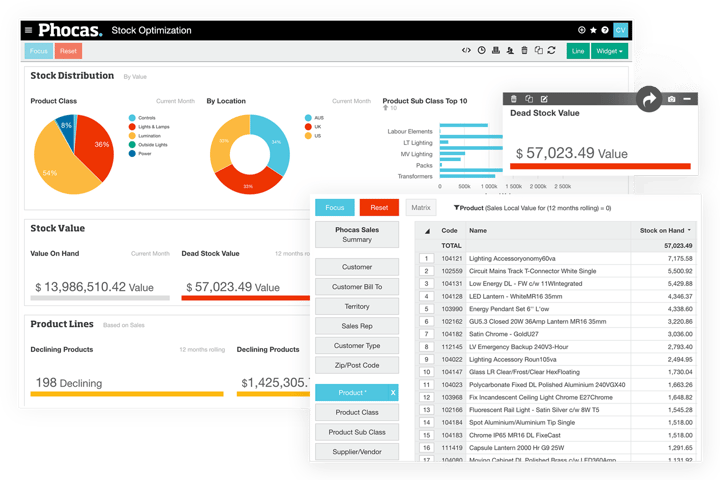
Optimize stock
Forget managing stock using your ERP or spreadsheets – see how Phocas makes it super easy to stay on top of your inventory. -

Phocas AI
Discover how Phocas AI helps you uncover insights quickly helping you drive impact across your business.
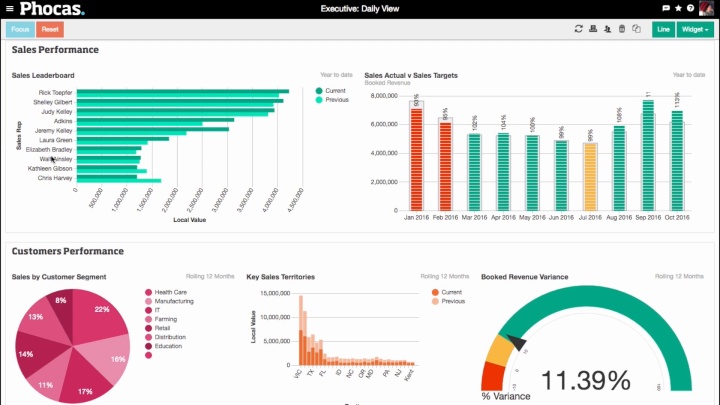
Tell your story in seconds
Clearly show your position and KPIs and gain a comprehensive view of your business, with custom graphs and dashboards that you can share in a few clicks.
- Interactive dashboards incorporating real-time data allow you to see company performance as a whole.
- Graphs, charts and graphics allow you to share business insights in a simplified format, improving individual and team engagement.
-
Quickly jump from data visualizations into the underlying data, slice and dice the metrics to answer your questions.
Customer quote
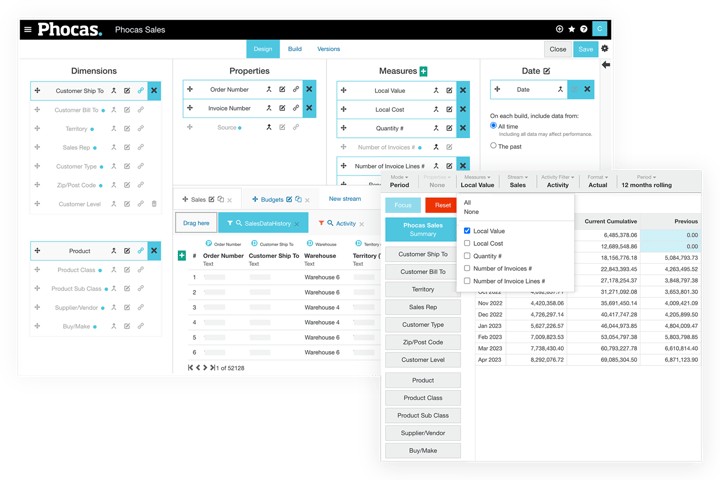
Freely explore any way you like
- Phocas' unique Grid is an ad-hoc analysis layer that allows free-form analysis.
- Drill down from high-level dashboards to cost centre, GL code and transactional-level data for the ordered detail.
- Users can create and save reports, alerts and dashboards to answer the questions relevant to their role and needs.
Customer quote
Epicor + Phocas customer
Intuitively simple for everyone
- Hit the ground running with built-in dashboards, customizable reports, personalized onboarding and ongoing support tailored to your needs.
- Simple for administrators to bring in new data sources and configure Phocas to suit your business needs - all with drag and drop functionality
- No waiting for reports to be built. Allow users to get their data and their results in real-time, so they can quickly move on to what they need to do.
Phocas Analytics benefits
Visualizations
Bring data to life and use it as a daily guide with meaningful dashboards that show your progress towards targets.
Dashboards
Excel spreadsheets and static reports? It’s much easier and more rewarding to view real-time data on interactive dashboards.
Collaboration
Get on the same page as your team. Share facts and figures and move towards your goals together.
Reporting
Quickly jump from from a rich visual analytics summary into the underlying detail and uncover the whole story.
Technology
Phocas meets strict requirements around security, compliance, availability and performance.
Understand the past, operate better today, and plan well for the future