Add levels in a financial statement
2:16 min
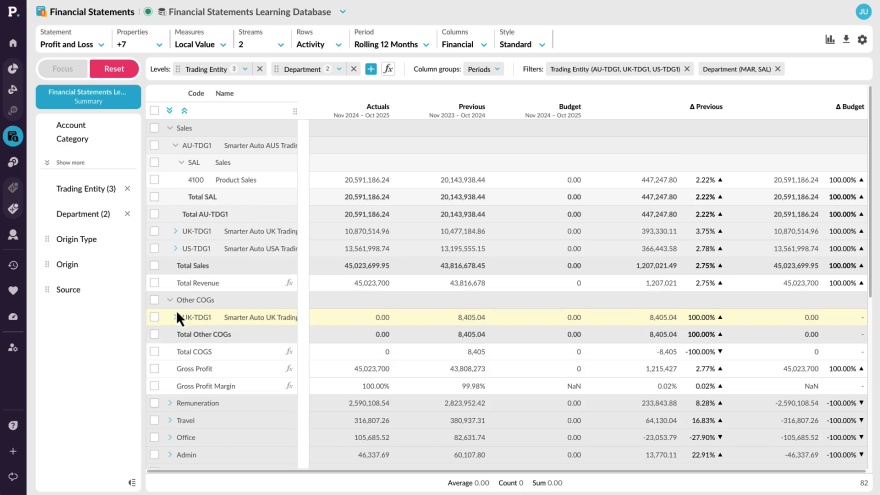
Learn how to add levels to your financials to break down data and easily see how individual items contribute to overall performance.
Supporting documentation
 Help & support
 Related video tutorials

Find your intercompany journals
Learn where to find Journals: a simple, flexible tool for entering debit and credit-style journal entries for a range of different use cases.
1:00 min
Create an intercompany journal
Learn how to use the journal data entry tool to make manual adjustments to your numbers and publish these back into your financial statements.
2:18 min
Budget by region and branch
Easily manage your budgets at both the regional and branch level by using the Financial Statements and Budgets & Forecasts modules together. They’re designed to work seamlessly, giving you a flexible, all-in-one solution for all kinds of budgeting needs.
6:13 min
Create a financial statement
Learn how to create a custom financial statement to suit your business needs from scratch.
3:15 min