Tell your data story in seconds

Clearly show the data that drives business decisions
The key to managing your data’s complexity is simplifying the analytics and data discovery process. Funneling all your metrics into a centralized platform and creating easy-to-understand data visualizations is essential when dealing with vast amounts of information.

Self service
Pinpoint business-changing opportunities
When you drill down into the data underlying the dashboard, it becomes easy to ask questions in the moment — and answer them in real-time. Slice and dice the data to follow your train of thought and get the answers you need on the fly.

Automate reporting
Accessible, accurate, fast
When you have all business data centralized in one analytics platform, along with the ability to set up automated alerts and reports, delivering your findings is so much simpler. Clearly show your insights using a dashboard that provides at-a-glance clarity. Send it directly to the intended inbox or tag the right people or teams within the Phocas platform. Easing the reporting burden and ensuring teams are proactive when it comes to opportunities or risks.

Human-friendly BI dashboards
Build the view you want to see by customizing dashboards to suit your needs. Include any data and visual analytics, then revise as you see fit — all without the help of IT.
Shareable
Insights can lead to impactful change when communicated to the right teams. Easily collaborate with others by creating favorites, saving queries and “@” mentioning team members. You can also apply permissions to ensure only the relevant people are viewing certain data.
Easy to understand
With so much important information in one comprehensive, graphical view, your business will wonder how it was possible to clearly view, understand and make better decisions before dashboards.
Clever dashboards
See everything from suppliers, locations, products, sales, stock holding to salespeople. See what's happening in real-time with business intelligence dashboards.
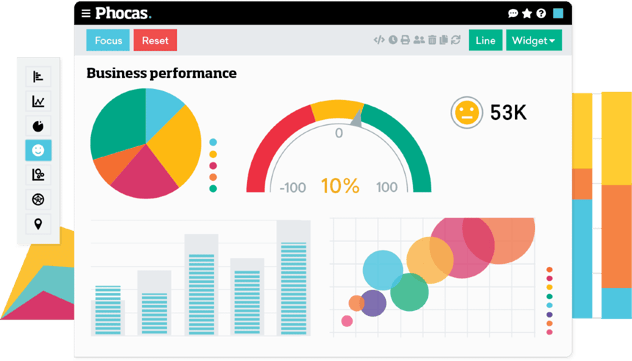
Have a play... click on something in a table or graph and press Focus in the top left to isolate the data points on your area of interest. Reset to start again.
Frequently asked questions
A dashboard in business intelligence (BI) is a visual display of the most important information needed to achieve one or more objectives, consolidated and arranged on a single screen so the information can be viewed and understood at a glance. Dashboards organize, store, and present key performance indicators (KPIs), metrics, and critical data sets to provide a quick overview of the company's current performance.
A BI dashboard makes data analysis easy and painless by empowering your whole team to make quick and informed decisions based on real-time data sets. Freeing up IT and finance to concentrate on more valuable ad hoc requests. Dashboards,built into a business intelligence platform can help steer your organization away from sharing business data in excel spreadsheets and static reports, improving data management and security.
Organizations use dashboards within business intelligence software to monitor business performance, track progress against goals, identify trends, make predictions, and uncover actionable insights. Dashboards are an important business intelligence tool that help business users to review various metrics and data visualizations, enabling them to respond quickly to changes, and communicate results effectively across departments.
To create a BI dashboard, start by identifying the key metrics that align with your business goals. Choose a BI tool that integrates smoothly with your ERP software and multiple other data sources and offers a level of self service functionality and customization that empowers everyone to use the software effectively - not just the data analysts. Design your dashboard layout to present data clearly, using charts and graphs for visual appeal. Ensure it's interactive for deeper analysis, and keep it user-friendly for all team members. Test and refine your dashboard based on feedback to ensure it effectively supports data driven decision-making.
Understand the past, operate better today, and plan well for the future
Whether you want to get your data organized for your team or you’re looking to combine business intelligence capabilities with financial reporting, planning and forecasting… We can help.
Get a demo
