How do I create custom reports in Sage?
As a leading Enterprise Resource Planning (ERP) system, Sage Group plc dominates the market with its cloud-based business management solutions; serving millions of small and mid-sized businesses globally. Whilst it excels at processing transactional data across its various products, the default report templates available in Sage intelligence often come under fire from its user community.
Sure, there’s plenty of standard reports in Sage but do they meet your exact needs? Probably not if you’ve stumbled across this blog. In fact, the inability to quickly and easily customize financial reports is one of the biggest criticisms we hear from Sage users, and the number one reason why they turn to easy-to-use Financial Planning & Analytics (FP&A) software like Phocas.
In this blog, we discuss some of the common challenges we hear with trying to build custom reports in Sage, share a simple step-by-step for customizing your financial reports and explain why Phocas Software could be the remedy your business needs for all its Sage reporting headaches.
Common challenges when building Sage custom reports
Building custom reports in Sage can vary in difficulty depending on the Sage product you’re using, your familiarity with the software and your business’ bespoke report requirements.
Here are some of the most common challenges we hear from Sage users when trying to customize their financial reports:
Limited customization options
Sage offers various default reports and customization options. However, finance teams may feel restricted in their ability to customize or create new reports in Sage due to predefined report templates with fixed layouts and fields. For example, users can select a report template in Sage and customize a few fields such as the report name and column headings, but may struggle to create custom fields, reports and dashboards.
Difficulty accessing data
OK, so if you can’t customize financial reports easily in Sage, why not just export the data to Microsoft Excel and manipulate it in there? Well, that isn’t always as easy as it sounds either. Downloading financial reports from Sage can be very time-consuming. Additionally, Sage’ financial reporting capabilities can feel rigid, especially when exporting to Excel as data is often hardcoded without formulas.
Sage stores data in a sophisticated database structure, which means that non-technical users need to rely on someone with the access and expertise to extract the raw data they require. Not only does this restrict a users’ ability to self-serve and feel empowered, finance and IT teams, who are often the Sage “gatekeepers”, then have to spend a disproportionate amount of time preparing financial business intelligence reporting, rather than working on value-add activities.
Love them or loathe them, relying on spreadsheets long term for financial reporting poses a significant risk due to them being static in nature, insecure and prone to human error. They’re especially not ideal if you need to integrate non-Sage data into a custom report as it’s an entirely manual process and if something is incorrect or someone requests a change, it’s back to the drawing board.
Lack of training
We also frequently hear from Sage users that they’re either not familiar with, or feel comfortable with, all the reporting capabilities their Sage product offers due to a lack of training or tutorials. Some of the Sage products have a steep learning curve when it comes to reporting and analysis, and inevitably, this can lead to user frustration when attempting to generate customized reports.
Creating custom financial reports in Sage is possible, but it requires a good understanding of the software's reporting features and may involve navigating through complex menus and settings. Users with limited technical skills may find it challenging to design and modify reports effectively. In some cases, it may even require knowledge of Structured Query Language (SQL) in order to tap into Sage's database directly to make the necessary report modifications.
Upgrades and compatibility
Each of the Sage products vary in their features and functionality. As a result, customized financial reports may become incompatible or require reworking when businesses upgrade to newer versions of Sage software. Changes in software architecture or data structures may impact existing customizations, therefore requiring updates and validation to check they’re still fit for purpose.
Maintaining custom financial reports over time can be resource-intensive; requiring ongoing monitoring, troubleshooting and updates to accommodate changes in business processes or regulatory requirements.
A step-by-step to building custom reports in Sage
With these common challenges in mind, here are some steps we recommend following to build custom reports in your Sage product:
1. Identify your requirements: Understand what data you need in your custom report and how you want it to be presented. Sage does come with pre-built reports that may partially meet your needs. Explore these first to see if any can be customized to fit your requirements.
2. Use Sage Report Designer: Report customization options vary by product but Sage usually includes a report designer / report manager tool that allows you to create custom reports using a drag-and-drop interface. You can select data fields, arrange them, apply filters, and format your own reports to your liking. This tool often doesn't require advanced technical knowledge.
3. Write custom SQL Queries: For more complex reports such as those required at year end, or where the default reports simply don’t meet your industry-specific needs, you might need to write custom SQL queries to extract the data you need directly from Sage's database.
4. Use a third-party: Alternatively, if you don’t have SQL skills in-house you can use consulting services available from Sage or third-party vendors such as your Sage Business Partner to customize the report on your behalf. However, this isn’t a quick fix as it doesn’t allow non-technical users to self-serve and will inevitably incur an additional cost.
5. Testing and refinement: Once you've built your custom report, thoroughly test it to ensure it's providing accurate and relevant information. You may need to refine it based on stakeholder feedback and further requirements.
6. Integrate with external reporting tools: Depending on your version of Sage and your organisation's needs, you might want to explore integrating with dedicated financial reporting tools such as Phocas. This can provide additional flexibility and functionality for creating custom reports, with all the familiarity of Microsoft Excel.
In summary, building custom reports in Sage can range from being relatively simple using built-in tools to more complex if you need to work directly with the database or integrate your Sage data with non-Sage data. The level of difficulty largely depends on your familiarity with the software, your in-house technical skills, and the complexity of the financial report you need to create.
Save time by creating custom reports in Phocas
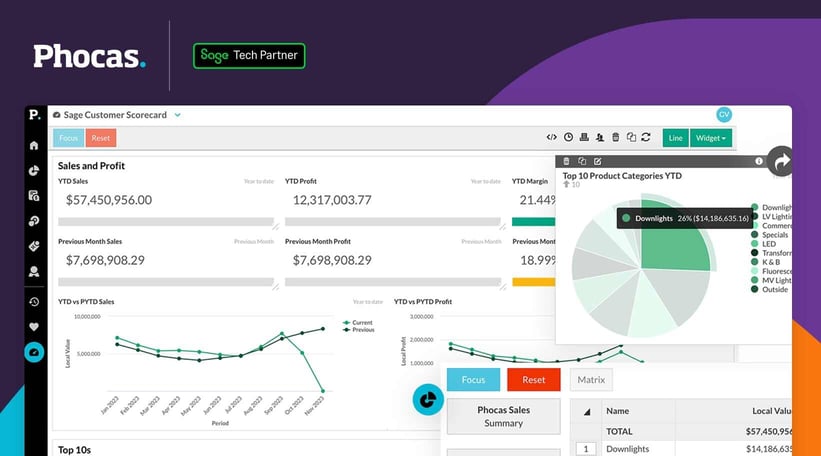
Phocas Software is a certified Sage partner that provides flexible and real-time financial reporting and analysis to hundreds of Sage users worldwide. It brings together a business’ ERP data, and multiple other sources of data, into a single, centralized platform which makes it faster and easier for those who require access.
With seamless ‘out of the box’ integrations for Sage 50, Sage 100, Sage 100 CRE, Sage 200, Sage 300, Sage 300 CRE, Sage Intacct and Sage X3, all financial report templates come pre-built in Phocas which helps to save time and hit the ground running. But, the added benefit of Phocas is that the reports are fully customizable and you don’t need to be really techie to customize them either.
Phocas effectively acts like an interactive custom report writer for your Sage solution. Anyone can use it to effortlessly customize financial statements without requiring any SQL knowledge or continuously outsourcing changes at an additional cost. Users don’t need to rely on finance or IT either, they can run their own reports and build dynamic dashboards; all whilst keeping the business’ Sage data completely intact. Sensitive information is also protected with data access and security defined at a user level.
Sage 50 and Phocas users, Woodberry believes this level of data autonomy has transformed its company culture. Tim Barr, Head of Finance at Woodberry says that pre-Phocas he was spending anything between 2 to 5 hours a week analysing data. Now, people can self-serve, explaining "It’s very rewarding to be able to give staff and teams access to data that they can understand and drill themselves."
So, can you easily customize financial reports in Sage?
The honest answer is - it depends on what level of reporting you want to do.
Sage provides robust financial reporting capabilities with a raft of existing reports, but we frequently hear that customizing these reports to meet specific business needs can be challenging.
If it’s just standard financial reports you’re looking for that are based on your general ledger data held in Sage, then happy days. But if you want something bespoke to meet your business’ unique requirements, you need someone in house with SQL knowledge, the support of an external Sage consultant or, if you want your whole business to feel empowered and free up time for your finance and IT teams, explore dedicated FP&A software for Sage such as Phocas.
Make your Sage data more accessible with business planning and analytics
Download now

Before joining Phocas as an in-house tech writer, Ali worked as a freelancer and brings a wealth of industry experience to her writing. She previously occupied a senior management position at a national distributor of plumbing and building supplies in the UK. Ali has a genuine passion for writing about ways to help businesses feel good about data.
Related blog posts

Phocas Software helps Sage customers gain more insights from their business Phocas Software, a business planning and analytics platform for sales, operations, and finance teams, announced a new technology partnership with Sage, the leader in accounting, financial, HR, and payroll technology. Phocas products are now integrated with Sage Intacct, making it easier for companies to access, analyze, report, and share information in their systems.
Read moreBrowse by category

Find out how our platform gives you the visibility you need to get more done.
Get your demo today