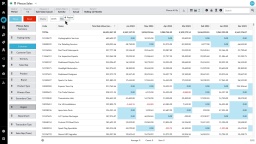
Use custom mode to show target performance
5:06 min
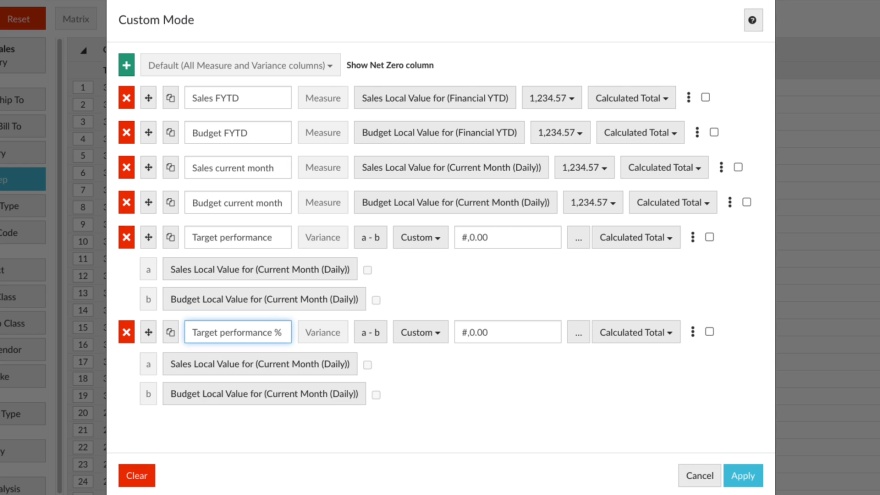
Learn how to use custom mode to add columns to the Phocas grid to compare sales and budget, track sales rep performance, and customize how your data is displayed.
Supporting documentation
 Help & support
 Related video tutorials
Forecast months of stock on hand (custom mode)
Learn how to build a stock report that calculates the months of stock remaining, based on the average quantity sold and stock on hand. This is done by adding a new column with a few simple calculations.
2:21 min
Add custom columns to financial reports
If you have permission to customize statements, you can design your own version of a Profit and Loss statement and Balance Sheet statement by defining the columns that they contain, giving you much greater flexibility in the layout and analysis capabilities.
3:57 min
View financial information in a matrix (change column groups)
Learn how to use Column Groups to show financial data side-by-side in a matrix format. This setup allows for quicker comparisons and makes it easier to spot differences in performance.
2:25 min
Add levels to the grid (nesting)
Learn how to bring together related data from different dimensions as an expandable report in the Phocas grid using the 'nest' feature. Grid nesting allows you to display up to three levels of detail, grouped by dimension.
1:59 min