Bring statistical streams into a Financial Statements database

Learn how to add statistical streams to a Financial Statements database in Designer so you can include non-financial information, such as units sold or customers, alongside your financials. You create each stream, mark it as statistical, assign a sync item, map the values, and build the database.
Supporting documentation


Related video tutorials

 Financial Statements
Manage streams and scenarios
Learn how to use Manage Streams and Scenarios, also known as Combined Streams, to control which data appears in your statements. You'll set the default stream order for all users, create a scenario that combines streams such as actuals and allocations, and hide streams you rarely use.
 Financial Statements
Combine statistical and financial data for better business insights
Learn how to use statistical streams in Financial Statements calculations with the STAT and AVG functions. STAT adds values over time, while AVG averages them, so you can calculate revenue per unit sold or operating profit per customer and compare performance across business entities.
 Analytics
Explain the variance, don't just log it
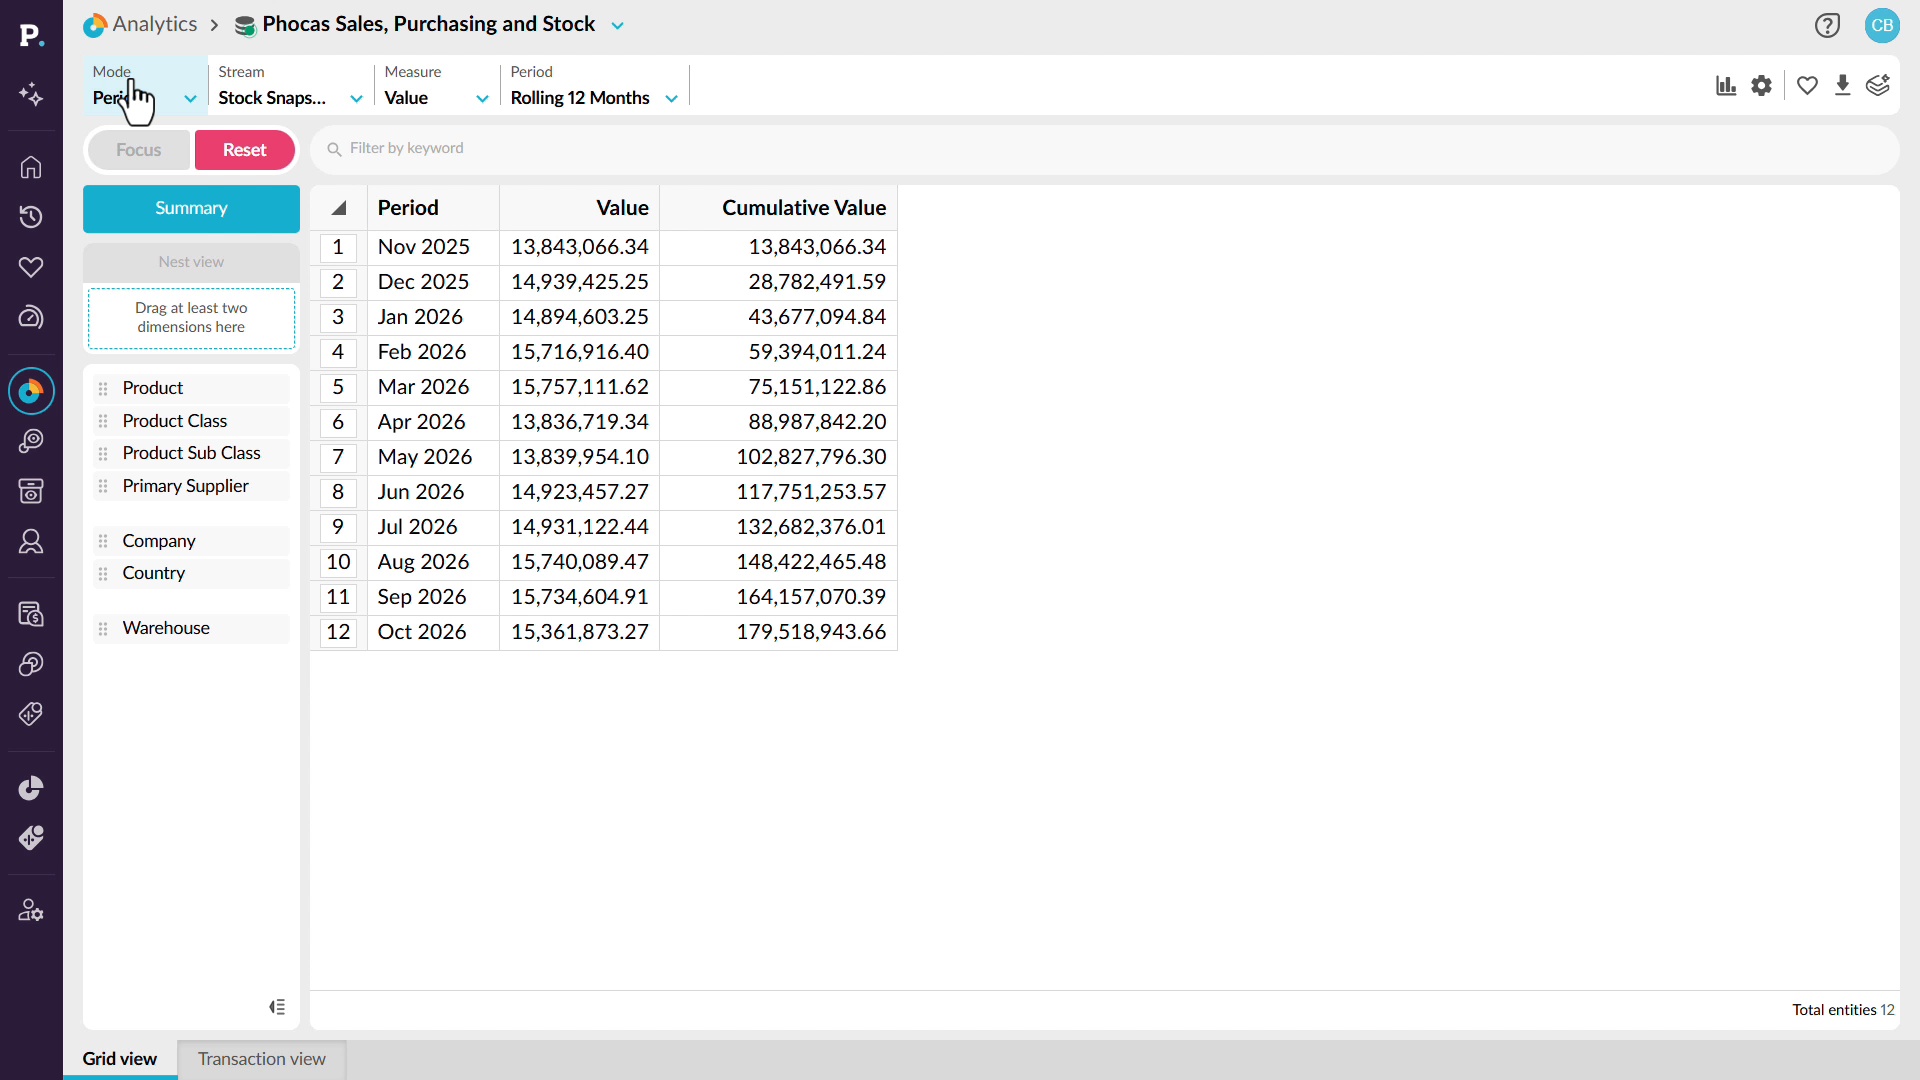
Learn how to find the cause of cycle count and adjustment variances so they stop recurring. You'll view a stock snapshot over 12 months, switch to variances, and compare product groups to spot the largest discrepancy. Drilling into that item turns unknown shrinkage into a specific pattern or location, such as a bin or user, where your data supports it.
 Financial Statements
Edit a financial statement
Learn how to edit a financial statement so its layout and formatting match your reporting needs. You'll add groups and calculations such as gross margin, arrange rows, apply formatting and performance indicators, choose the revenue row for percent revenue analysis, and build the database so your changes take effect.
