Generate a budget based on previous sales (custom mode)

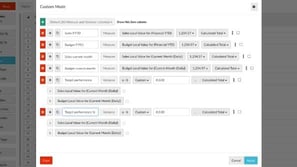
Learn how to use Custom mode to turn sales from the past two years into next year's budget. You'll add a calculation column that averages the current and previous periods, applies a percentage increase, and then view the resulting budget by product type for a selected sales rep.
Supporting documentation
 Analytics (Classic)

Related video tutorials
 Analytics (Classic)
Use custom mode to show target performance
Learn how to add and define your own columns in Custom mode, including choosing the stream, measure, and period for each one. You'll clone columns to save time, add variance columns that compare sales to budget as a value or percentage, and format column values with a prefix, suffix, decimal places, or thousand separators.
 Analytics (Classic)
Compare data with Matrix mode
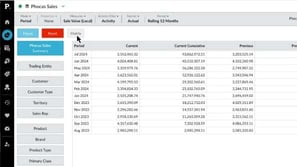
Learn how to enable Matrix mode by selecting a dimension and the rows you want to compare, which then appear side by side as columns in the grid. Add other dimensions to see detail such as regional contribution to sales or sales value by brand. Then select customers and filter a column to equals zero to find those who bought one item but not the other, giving you cross-sell opportunities.
 Analytics (Classic)
Use Market Mode to analyze market penetration
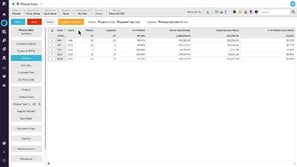
Learn how to define a market, choose a segment, and count items such as customers to calculate market penetration in Market mode. You'll also see how the market, segment, and percent of market columns work with your measures, and how to clean up the view by switching measures off.
 Analytics (Classic)
Combine inventory and sales to find dead stock
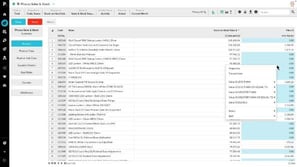
Learn how to identify dead stock by comparing stock on hand value with sales value by product in total mode. Right-click a cell showing zero and filter for an exact value of zero to list items with no sales in the current month, then slice by warehouse and supplier to see where the most dead stock sits. You get the information you need to act on it quickly.
