A business intelligence and financial planning and analysis (BI and FP&A) platform allows finance teams to integrate multiple sets of data sources together to create financial statements, budgets and forecasts.
Finance professionals recognize that these planning and month-end documents hold a wealth of insights and potential value beyond reporting and compliance. To get the most from the time spent refining and customizing financial statements, we recommend converting these findings into financial dashboards that consist of data visualizations such as graphs and charts which people can drill down into for more information.
Dashboards do more than present numbers. They provide a quick overview of your financial progress and allow for the measurement of non-financial metrics and KPIs. Dashboards foster informed decision-making and strategic planning for all individuals within a business.
Financial dashboard examples
1. The CFO dashboard or financial performance dashboard
If you manage multiple business units, you can consolidate the performance of them all in your financial statements. So why not display the real-time data in various ways on a single financial reporting dashboard and it becomes the perfect CFO dashboard with key performance indicators at a glance.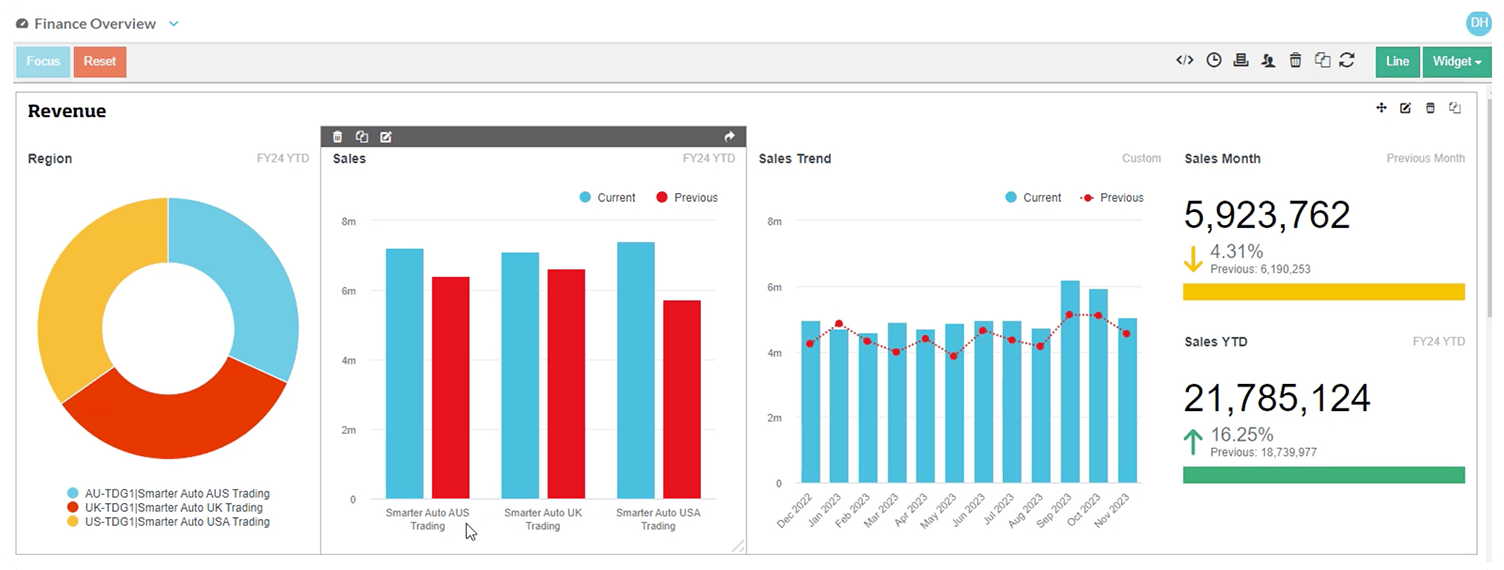
Consider the scenario of operating in three regions—America, the United Kingdom, and Australia. You have the option to represent total revenue through a chart, using distinct color codes for each division.
Financial data such as current total sales can also be viewed per region and compared to the same period in the last FY so you can assess whether performance is up or down from the previous year. Sales trends can also be mapped so you can quickly determine how current monthly sales compare to last year. Often business people like to know the current sales for the month (compared to the previous month) or sales YTD compared to the previous year. These can be expressed in the dashboard as totals for quick reference in your financial reporting.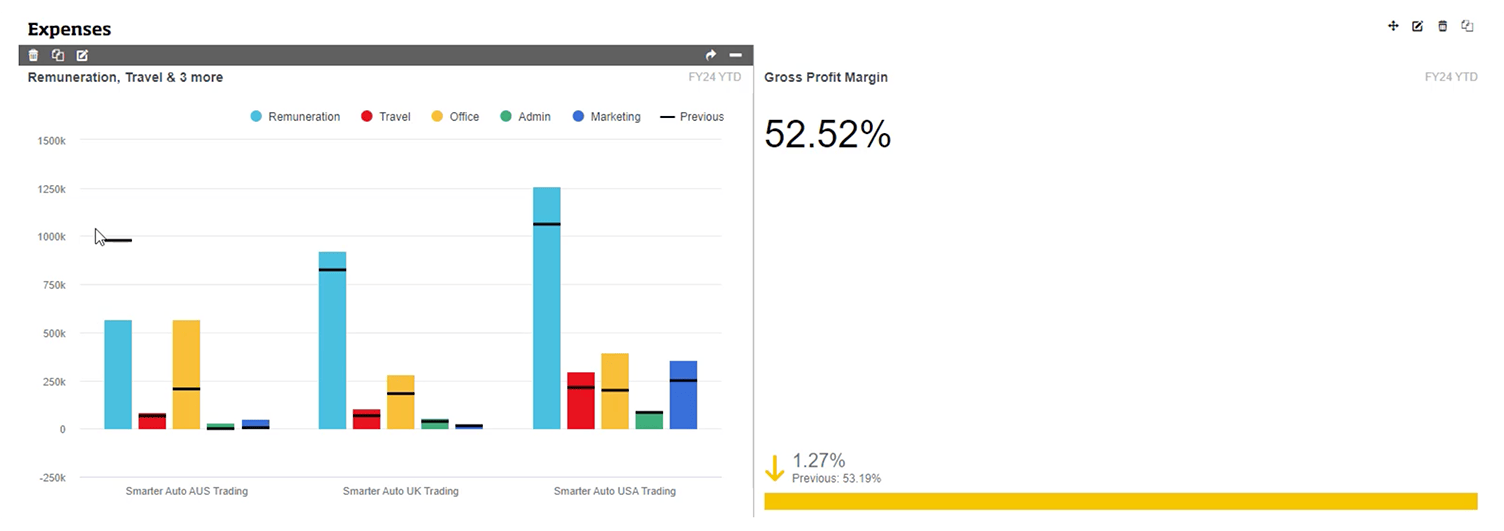
The remaining section of the dashboard displays annual expenses, allowing you to visualize how these expenses are categorized in your profit and loss (income statement). In this instance there are 5 main cost areas broken down by renumeration; travel, office rent, admin and marketing so you can compare to last year's operating expenses.
Gross profit margin is an important ratio for this company as the business model is about selling products meaning margins are the go-to measure and are prominently emphasized. Many business unit leaders would be interested in why this ratio has dropped from last year. A CFO might also choose to create a CFO dashboard that has all the financial KPIs he or she might be interested in knowing about in the short-term such as net profit margin, working capital ratio, accounts payable turnover ratio, debt-to-equity ratio, current ratio and quick ratio so financial analysis can be immediate.
2. Inventory-related metrics dashboards
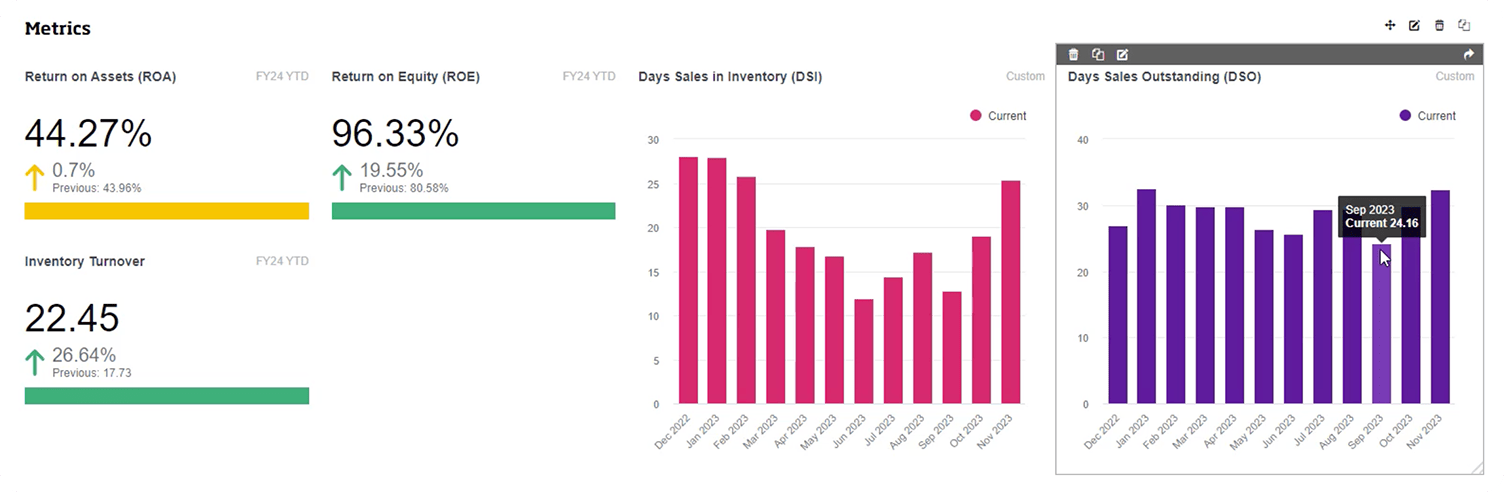
Key metrics that business people can track via financial dashboards can be a combination of both financial and non-financial metrics. If you sell products, you're likely interested in an inventory-related metric dashboard and track Return on Assets to Return on Equity.
A telling metric for many inventory-based businesses is Days Sales in Inventory (DSI), which measures the number of days it takes on average to sell its in inventory. On this dashboard, the average days has been graphed so that each month can be assessed in detail. The DSI was low in June at 12 days but is now increasing. This would be an area to monitor to determine potential issues with slow moving stock or having too much stock which can also lead to cashflow issues.
Days Sales Outstanding (DSO) is a financial metric that measures the average number of days a company takes to collect payment (accounts receivable) after a sale has been made. DSO is also known as Days Receivables and also affects cashflow.
3. Balance Sheet metric dashboards
Balance Sheet items can also be mapped to financial dashboards providing more valuable insight into your financial health especially around liquidity, debt management and working capital.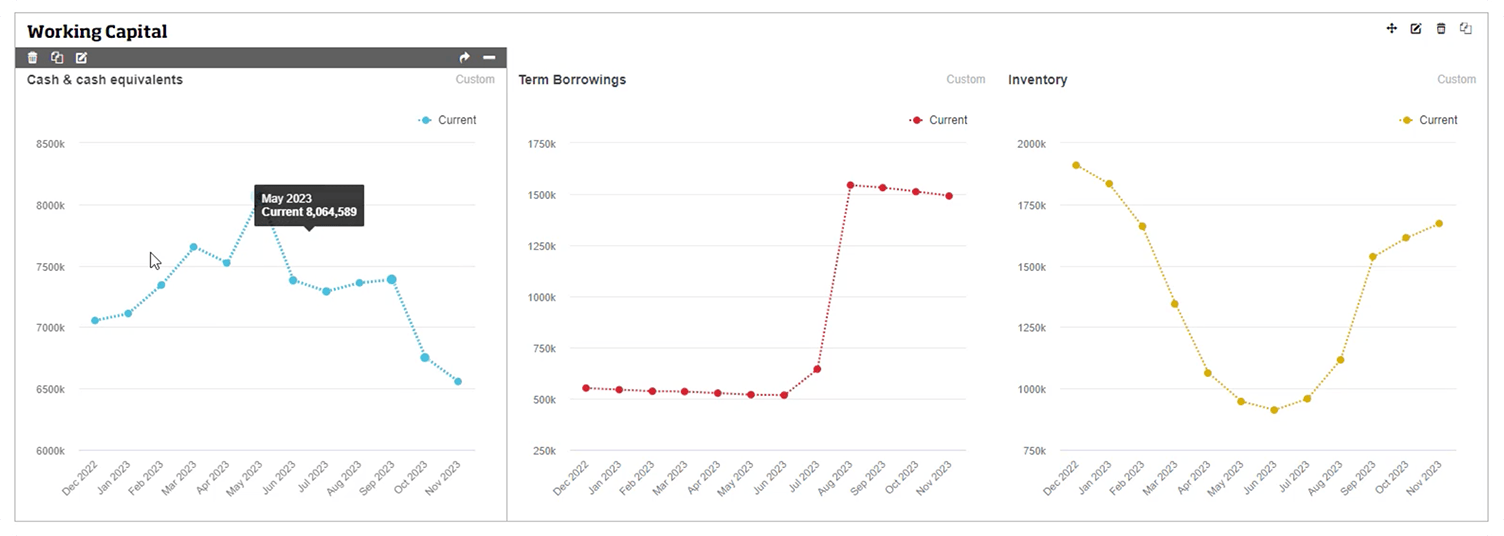
The working capital dashboard is tracking cash, debt borrowings and days sales in inventory – all strong measures for understanding your cash balance. The first chart shows that cash is trending downwards and the second shows that this company has also taken on considerable debt in the last twelve months. Maybe the finance team has some additional finance costs that need to be mitigated here so they are effectively planning for the future. The third chart looks at days in inventory which can be used to ensure there is sufficient stock on hand without holding too much.
4. Sparklines budget dashboard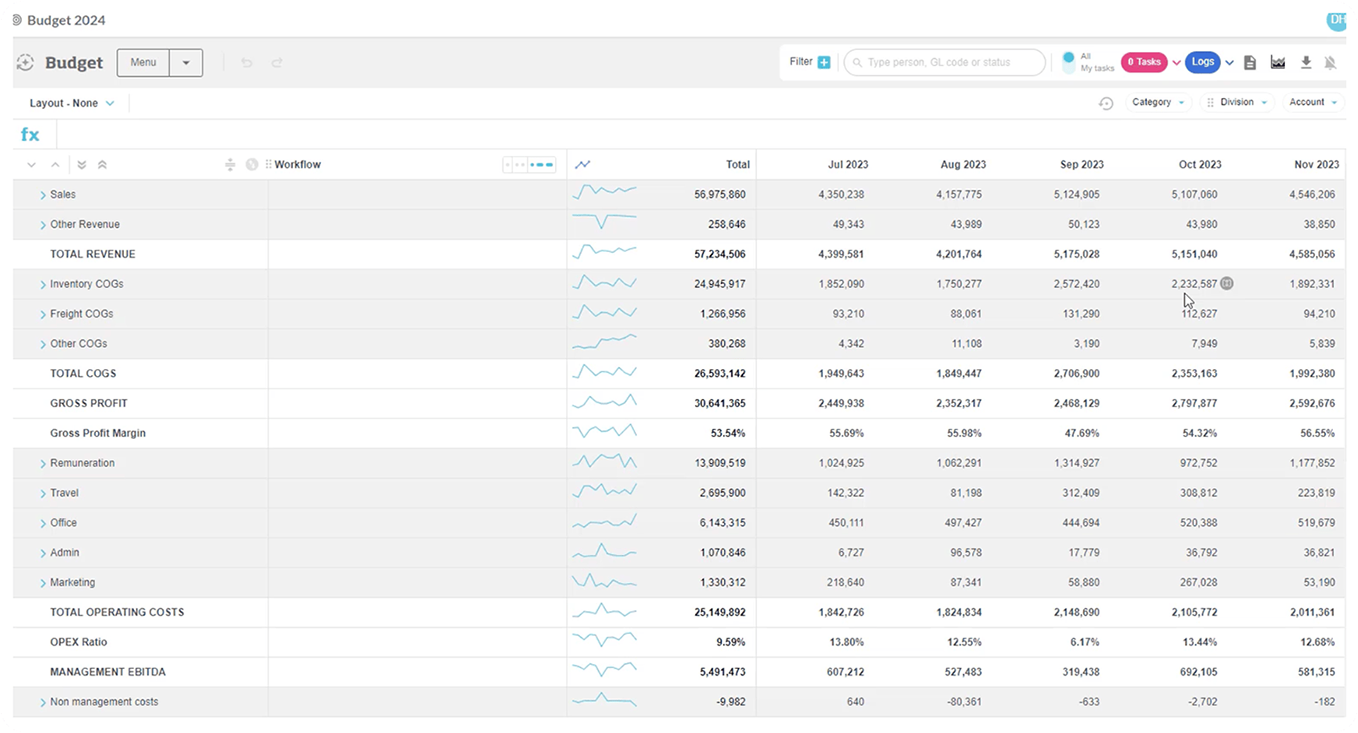
When a budget model is created in the Phocas business planning and analytics platform, financial teams can view all the budget figures as sparklines. These tiny graphs represent all budget figures across the year. Integrating sparklines into the budget model provides a visual representation of all financial information. This visual analysis serves as a simple yet effective method for double-checking the budget across the period, saving considerable time in identifying trends or issues within the budget before moving forward.
All of these financial dashboards can be created in Phocas Financial Statements with the goal to present complex financial information in a user-friendly and actionable format. Dashboards help decision-makers better understand business performance at a glance, enabling more efficient and informed decision-making.


Chartered accountant and expert adviser on streamlining budgeting and reporting for the mid-market.
Related blog posts


Browse by category

Find out how our platform gives you the visibility you need to get more done.
Get your demo today