For many sales professionals, the phrase daily sales report used to conjure up thoughts of frustrating delays and data that's already stale by the time it is received. Often these reports were created by the IT or finance team who had a long list of requests, so the information was more of an historical snapshot. Fortunately, the creation of sophisticated data analytics has improved this work, transforming sales reporting into a self-service and quick task.
A daily sales report brings together sales data from multiple sources like Enterprise Resource Planning (ERP) systems, Customer Relationship Management (CRM) platforms, e-commerce, sell through data from third parties and potentially some Microsoft Excel spreadsheets. Prior to data analytics, there were lots of manual workarounds to gauge progress towards sales goals.
A data analytics system empowers users across the organization to access sales data in real-time and across any relevant division. With a platform like Phocas, the creation of comprehensive and accurate reports is achievable with just a few clicks. This allows for dynamic exploration of your data, allowing you to drill down into the specifics of transactions that are all verified and connected to the source, so you can streamline your entire sales process.
Create a report specific for your needs
With a user-friendly data analytics solution, everyone from the frontline salesperson to the sales manager can quickly generate custom reports tailored to their specific needs. One of the most common pieces of information a sales rep wants to know is,‘What did I sell yesterday?’ For a sales manager, it usually extends to ‘What did my entire sales team sell yesterday?’ Let's illustrate how straightforward it is to create a report to view precisely what customers purchased on the previous day using a system like Phocas.
-
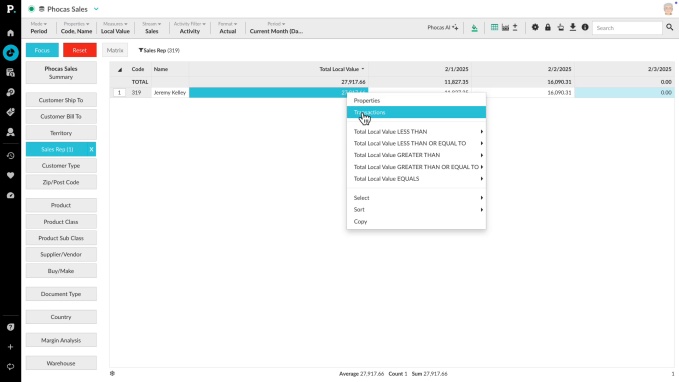
Select the sales representative on the main dashboard. You would typically begin by selecting the name of the specific sales rep you're interested in. This ensures the report is focused on their individual sales activities.
-
Define the Time Period by selecting the relevant time frame. While this example focuses on 'yesterday,' you could choose 'current month,' 'last week,' or any custom date range. This flexibility is key for various types of sales analysis.
-
Choose the right mode. To see a detailed breakdown of sales by date, you would click on the 'mode' option and select ‘transactions.’ This action populates the report with a chronological list of everything the sales rep sold yesterday, including product details, customer names and sales amounts.
-
Incorporate key measures. The 'measures' tab is where the power of customization works. Here, you can select a wide array of metrics to include in your report. Beyond simple total sales value, you might want to see cost, profit, margin percentage, average quantity sold per transaction, sales volume or even net sales after accounting for refunds. This comprehensive view allows for a much clearer understanding of sales performance and profitability. You can track the number of sales and the total revenue generated, providing a clear picture of the day's success.
Saving, sharing and automating reports
One of the standout features of an intuitive analytics platform like Phocas is the ability to save these customized views, often referred to as 'favorites,' and then easily modify them as needed. To save your newly created ‘Sales Rep (Shelly) Yesterday's Sales’ report as a favorite, you would typically select a star icon or a similar 'save' button. A dialogue box will then appear, allowing you to designate yourself as the owner, give the report a descriptive name (e.g. Daily Sales Report - Shelly), and add further details or a description for clarity.
You can then export this report, perhaps into an email format and subscribe sales rep Shelly to it. This means the ‘Shelly's Yesterday's Sales’ report will be automatically generated and delivered to her inbox every morning. By having this sales information readily available without manual intervention saves heaps of time and provides great insights.
The Phocas platform manages data security and permissions so the sales rep will only see the data that is relevant to them. This is a significant time-saving feature as it eliminates the need for a sales manager to manually create and alter individual reports for each member of the sales team. This level of automation and targeted information delivery empowers each salesperson with the data they need to monitor their performance against sales goals and adjust their sales strategy accordingly.
Users can also schedule the generation of these reports at specific times. For instance, a sales manager might schedule a weekly sales summary to run every Monday morning, or a monthly sales report to be generated on the first day of each new month. This ensures that key stakeholders consistently receive the information they need, when they need it, so they have better visibility of the sales pipeline and sales performance. This systematic approach to reporting can also address staffing and resource allocation across divisions.
The broader impact of sales reporting
The benefits of sales analysis extend far beyond just looking at yesterday's total sales. Modern analytics tools can help you track a multitude of key metrics and key performance indicators. You can analyze conversion rates at different stages of the sales process, monitor sales growth trends over time and integrate new data sources like third-party sales systems for a comprehensive view of transactions.

Visualizations such as graphs and bar charts make complex sales data easier to understand at a glance. A sales manager can quickly identify top-performing products or being aware of a dip in sales for a particular region through graph. For a small business looking to optimize operations or a larger enterprise aiming to refine its sales strategy, the ability to quickly perform sales analysis and generate a clear sales summary is invaluable. You can create or use a predefined daily sales report template to ensure consistency in your reporting. This capability to easily track sales and other associated sales KPIs provides a solid foundation for a more accurate sales forecast. Even specific reports like a sales call report can be managed and analyzed within such a system, improving workflows across the sales department.

Waiting for IT to generate reports that are often outdated upon arrival is unsustainable. Data analytics solutions put the power of real-time reporting directly into the hands of all sales teams. The daily sales report, once a dreaded chore, is now the first thing people look at each day, helping them map out the best way to generate strong sales growth.


Empowering businesses with intuitive data analytics, driving informed decisions for growth and profitability. We make people feel good about data.
Related blog posts


Browse by category

Find out how our platform gives you the visibility you need to get more done.
Get your demo today