
As bestselling author John Naisbitt once said, 'We are drowning in information but starved for knowledge.' Companies can gather extensive data on everything from business processes to customer experiences. However, without a clear data discovery process and advanced analytics in a BI platform, extracting valuable insights and truth from this data can be challenging.
What is data discovery?
Data discovery is a term related to business intelligence. It is the process of data collection and data classification to uncover the valuable insights that inform decision-making and improve business operations. It involves consolidating data from various sources, and using visualizations, ad hoc queries and advanced analytics to detect patterns and trends.
The data discovery process
The data discovery process is greatly enhanced with a business intelligence platform. This specific technology automates data preparation and ensures data quality, making it easier for business people to access and obtain actionable insights in real time.
The data discovery process also requires a custodian such as the finance department to work with all internal business partners and the various sources they use to ensure the right types of data are available in your data discovery tools.
Data management is also paramount to the data-discovery process. Once the relevant data is flowing, the BI system also manages data protection. Data governance (including data security and data privacy) are essential in the data discovery process to ensure that sensitive information remains protected (to recognized levels like SOC2) and compliant with privacy regulations like GDPR. The built-in governance and privacy protocols in the BI system allows businesses to manage access control, maintain data integrity, and safeguard sensitive data against unauthorized use or exposure.
Data processing is continuous so when the source data changes, the data catalog is always up to date with new data.
The goal: self-service data discovery
Following the initial data set-up and the data automation is streamlined, the data discovery process advances to data exploration and analysis. Ultimately, the goal of data discovery is to make data-driven insights accessible across the organization, allowing teams to make informed decisions quickly and with confidence.
Data visualization illuminates the data discovery process
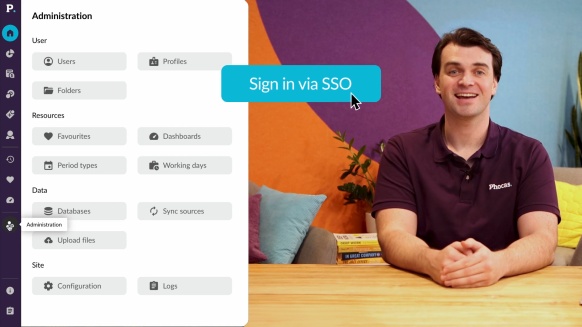
Once your financial, operational and supply chain data sources are consolidated into the data platform you can run endless queries to uncover data insights. Business intelligence (BI) tools play a critical role here, as they empower users to interpret complex datasets without extensive technical knowledge.
The BI software has an accessible user interface (UX) that allows business users to tap into the big data using advanced analytics. The built-in data visualization lets people see results in graphs or in dashboards so they can be up-to-date with metrics that help with their decision making.
There are hundreds of data discovery use cases and are often related to a persons job role. A finance person might be analysing accounts receivable outstanding to see if their are outliers that need to be followed up. A sales person might want to know what customers to target with new products. You can analyze what are the most common products typical customers purchase as a bundle and then you can find customers who have only bought one of these products, so they will be strong candidates for up-sell or cross sell.
With data discovery, the user searches for specific items or patterns in a data set. Visual tools make the process fun, easy-to-use, swift, and intuitive. Visualization of data now goes beyond traditional static reports. BI visualizations have expanded to include geographical maps, pivot-tables and heat maps giving you the ability to create high-fidelity presentations of your discoveries for stakeholders.
Data discovery further enhanced by artificial intelligence
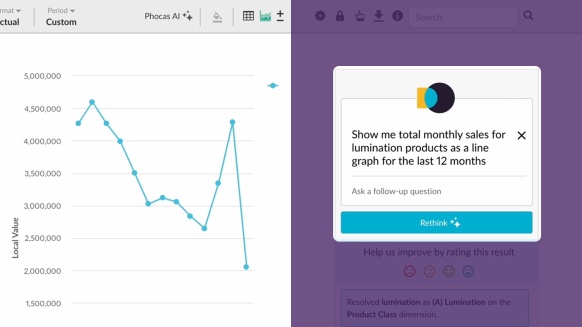
A new requirement in business intelligence is smart data discovery which of course means using artificial intelligence or machine learning technology.
In the Phocas business intelligence platform, artificial intelligence functionality makes data discovery instant. A user carries out data analysis via typing and asking a question of their data, this accelerates the data discovery process. What is a unique format to Phocas is the answer is broken down to steps so you can see how the algorithms work to arrive at the answer. Many first time users have found the smart data discovery tool to be advantagous in learning how the software works and what sections of the data are reviewed. Once a trend is identified, the software empowers you to unearth the contributing factors.
For instance, BI enables you to explore the data by region, different employees, product type, and more. In a matter of seconds, you have access to actionable insights to make rapid, fact-based decisions in response to your discoveries. Without BI, discovering market trend is usually a case of coincidence.
Discover trends you did not know where there
With data discovery, executives are often shocked to discover trends they didn’t know were there. Michael Smith of the Johnston Corporation had this to say after implementing Phocas business intelligence:
"Five minutes into my data discovery process, I had found items that didn't have the margin I was expecting, customers that didn't have the profitability I was expecting and vendors that weren't performing the way I expected. I realised that we were onto something that would be very impactful to our business."
These risk management discoveries allow companies to pinpoint unfavourable trends before they become a problem and take action to avoid losses.
With relevant insights, a company can now make data-driven decisions about effective strategies to acquire, serve, and retain valuable customers. Having a mountain of data is useless unless it is converted into meaningful information. The ability to discover the truth behind your data will go a long way to guarantee your company achieves and maintains its competitive edge.
For more information about data discovery download this free ebook, Choosing the right business planning and analytics platform

Katrina is a professional writer with a decade of experience in business and tech. She explains how data can work for business people and finance teams without all the tech jargon.
Related blog posts


Browse by category
 Get a demo
 Find out how our platform gives you the visibility you need to get more done.
Get your demo today