Inventory optimization drives efficiency
Empower your business to make informed decisions across various facets of inventory management, from inventory levels to supply chain optimization, with Phocas.
Inventory planning is all about the data
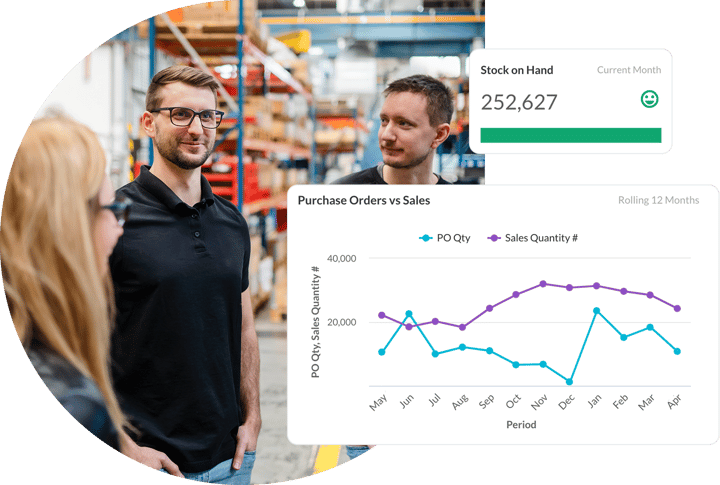
Phocas provides an inventory optimization software solution by pulling ERP data and other sources into one centralized platform. Making it easy for everyone to tap into sales, purchase order and inventory-level data. Helping to optimize inventory planning and improve demand forecasting.
Meet supply and demand
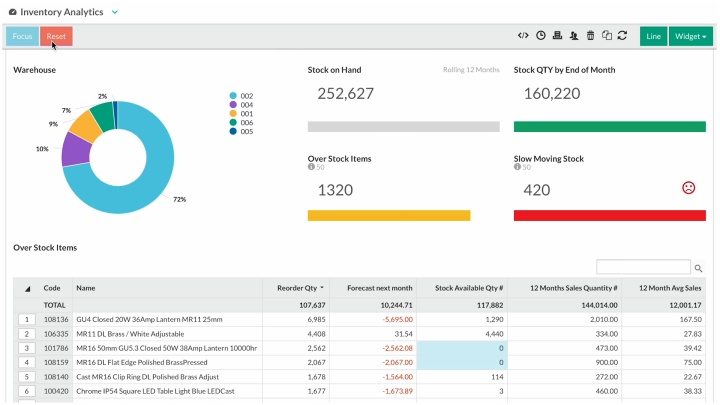
- Ensure optimal inventory levels with a clear view of what’s moving and what isn’t
- Forecast demand and see which products need replenishment, liquidating or moved between locations
- Track seasonality trends
- Use purchase history and sales forecasts to predict stock levels needed months in advance
- With accessible, up-to-date data, purchasing and inventory teams can control pricing, improve supply chain planning and maximize profitability.
Customer quote
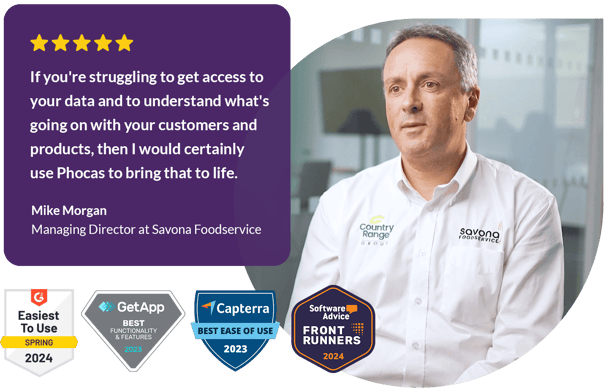
“We import a range of products from overseas where we need to order them months in advance. By looking at the sales history we can predict what stock levels we are going to need in the coming weeks and months. For stock management, Phocas is absolutely brilliant.”
— Chris Rath, Operations Manager at Tradeware.
Sage + Phocas customer
Forecast demand by segment
- Analyze patterns and forecast demand for different market segments; customer demand by product class, geography, sales channel, behavioral segments (purchase history), seasonality etc
- Adjust demand forecasts based on live sales data and changing trends
- Compare forecasted demand with actual demand data over time.

Smart purchasing and holding
- Review order quantities against purchased stock levels
- See which departments, categories or product lines are the most profitable inventory investments
- Ensure products are in the right locations and distribution centers based on customer demand
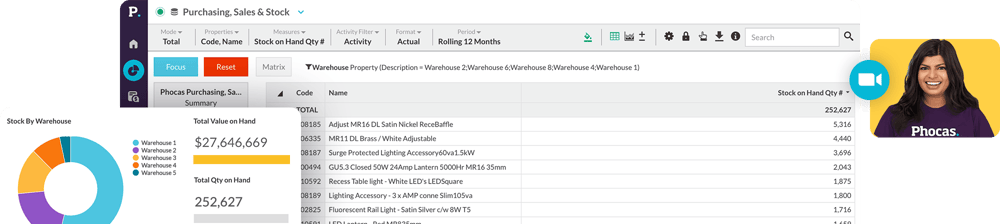
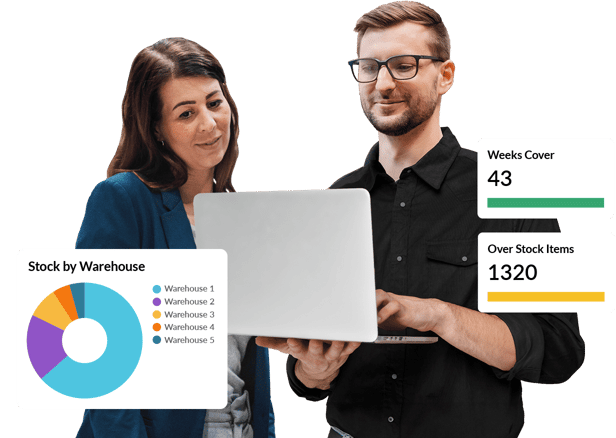
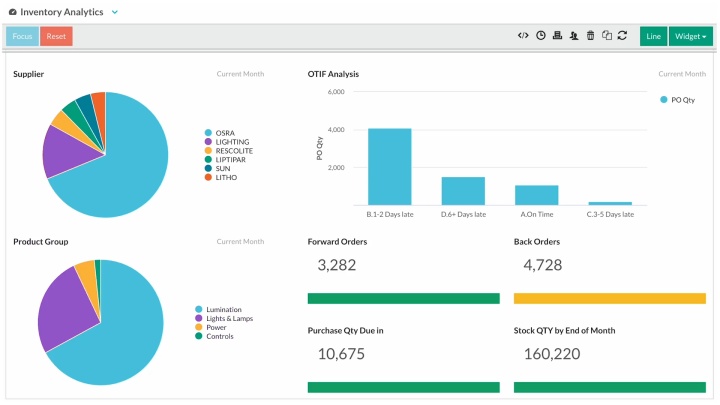
- Quickly see what you're holding and selling by location, quantity, value.
Clear inventory visibility
Phocas has helped Savona better plan for seasonality and establish different stock holding policies for different products depending on whether they’re identified as slow or fast moving.
Fast, accurate reporting for everyone
- Fast, easy access to all your data within a centralized platform makes it simple to pull reports instantly
- Human-friendly software empowers everyone to create their own reports or customize existing templates
- Independently view, understand and share up-to-date results with the wider business - sales, finance, operations.
Customer quote
“Our data in Phocas, combined with our retail partners' sales data lets us plan inventory to place the right commitments with our resources and vendors overseas. This allows us to make sure we're holding the right number of weeks stock domestically to meet demand. It ensures that we are running a profitable business.”
— Harvey Lewis, General Manager at Caprice.
Improve customer service levels
- Proactively improve supply chain management with up-to-date visibility into supplier performance, lead times, and order fulfilment processes
- Regularly reviewing supply chain performance on a cloud-based platform allows you to optimize procurement processes and mitigate risks associated with supply chain disruptions.
Simplify inventory management with one platform


View data any way you like
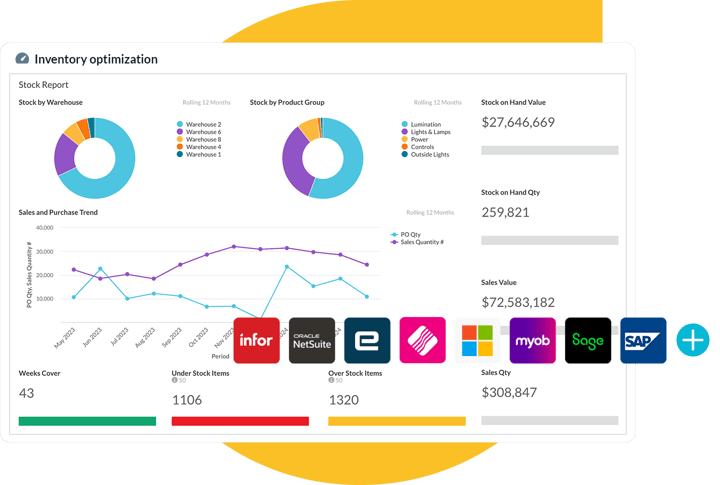
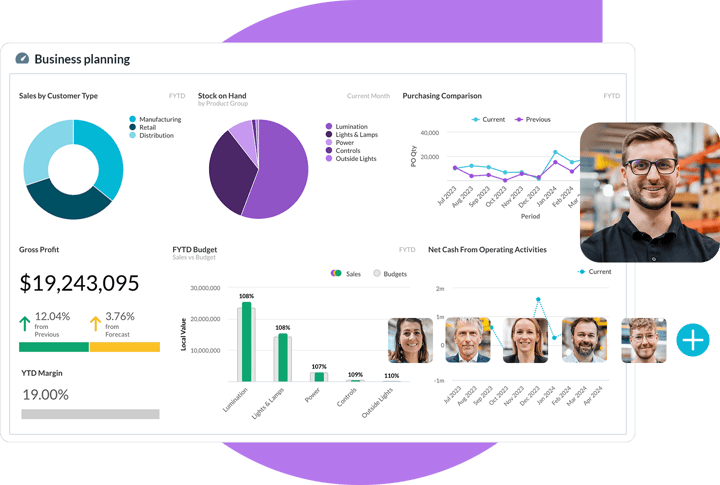
- Unlimited custom dashboards provide high-level overviews, enhancing multi-echelon (locations) inventory optimization
- Drill into underlaying dashboard data to identify areas such as excess inventory on slow-moving unprofitable stock
- Add customized calculations that make sense for your inventory planning such average inventory COGs over 12 months.
Featured Guide
Data-driven inventory optimization eBook
Discover how data analytics can improve inventory management
Download now
Understand the past, operate better today, and plan well for the future
Whether you want to get your data organized for your team or you’re looking to combine business intelligence capabilities with financial reporting, planning and forecasting… We can help.
Get a demo