Create and manage financial statements
35:23 minutes total learning time
Learn how you can customize financial statement layouts and contents to fit your organization's needs by adding, removing, and reordering items.
Phocas product  Financial Statements
10 videos in this learning module
1
Add a financial statement
1:53
2
Edit a financial statement
3:53
3
Map accounts to a group
2:40
4
Customize columns
3:57
5
Manage streams and scenarios
3:47
6
Reference a single account code in calculations
1:50
7
Set up your Trial Balance Statement
2:18
8
Bring statistical streams into a Financial Statements database
3:39
9
Combine statistical and financial data for better business insights
5:54
10
Add a custom calculation to your Income Statement
5:32

.png?width=695&name=thumbnail%20(10).png)
.png?width=695&name=thumbnail%20(11).png)


10 videos in this learning module
1
Add a financial statement
1:53
2
Edit a financial statement
3:53
3
Map accounts to a group
2:40
4
Customize columns
3:57
5
Manage streams and scenarios
3:47
6
Reference a single account code in calculations
1:50
7
Set up your Trial Balance Statement
2:18
8
Bring statistical streams into a Financial Statements database
3:39
9
Combine statistical and financial data for better business insights
5:54
10
Add a custom calculation to your Income Statement
5:32
Add a financial statement
Learn how to create a custom financial statement to suit your business needs from scratch.
Supporting documentation
Edit a financial statement
Learn how to edit an existing financial statement to suit your business needs.
Supporting documentation
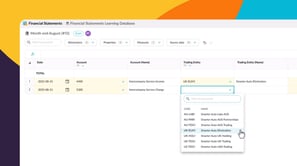
Map accounts to a group
Learn how to map accounts to any new or updated groups in your financial statements, to make sure they display correctly in the grid.
Supporting documentation
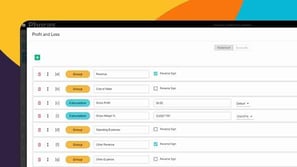
Customize columns
If you have permission to customize statements, you can design your own version of a Profit and Loss statement and Balance Sheet statement by defining the columns that they contain, giving you much greater flexibility in the layout and analysis capabilities.
Supporting documentation
Manage streams and scenarios
Learn how to manage your actuals, budgets, and other key data that appear in your financial statements—all in one place. The Manage Streams and Scenarios feature (also known as Combined Streams) gives you more flexibility and control over what data users can see when viewing your financial statements.
Supporting documentation
Reference a single account code in calculations
Learn how to display information for specific accounts in your financial statements, using the Account [acc] function to create calculations that reference single accounts within a statement.
Supporting documentation
Set up your Trial Balance Statement
Learn how to set up your trial balance statement and check end-of-period balances, total balances for Balance Sheet accounts, year-to-date balances for Profit and Loss accounts, and Retained Earnings excluding current-year Profit and Loss movements.
Supporting documentation
Bring statistical streams into a Financial Statements database
In this video for administrators, Nick shows how to incorporate non financial information, such as 'units sold' or 'customers', into Phocas financial statements. Learn how to make these statistical streams available to users by adding them to the financial statements database in Designer.
Combine statistical and financial data for better business insights
Learn how to highlight revenue per customer, operating profit per customer and other business insights by combining statistical streams with financial information. In this video for the Finance Office, Nick shows how to use these streams in calculations that will add depth to your financial statements in Phocas.
Add a custom calculation to your Income Statement
In this video David takes you through customizing an Income (Profit & Loss) Statement, adding an EBITDA calculation and customizing account groupings - all from the 'front end' of Phocas.
Supporting documentation
Phocas product

Related learning modules

Get started with Financial Statements
This module for beginners helps you get started in Phocas Financial Statements. Learn about the grid, layouts and charts and how to add a favorite view to your dashboard.
6 videos
12:44 min

Explore and analyze financial information
Discover how you can change statement views, apply filters, add detail, and drill down into your data to move smoothly from a high-level overview to detailed insights for deeper analysis.
4 videos
7:23 min
Add data to your financial statements
COMING SOON – This module introduces the Journals feature in Financial Statements: a simple, flexible tool for entering debit and credit-style journal entries for tasks like intercompany eliminations and management reporting adjustments. You’ll learn how to make quick manual adjustments between entities, publish them back to your financial statements, and streamline workflows when managing multiple ERPs or using Excel.
3 videos
8:38 min
Use financial statements for budgeting
This module takes you through key budgeting features using financial statements in Phocas. These videos help you plan and manage budgets more effectively.
2 videos
7:17 min