Financial Statements
4 sessions in this series
This 4-part Phocas User Group (PUG) series is designed to help finance teams unlock the full potential of Financial Statements. Learn how to analyze performance, streamline month-end reporting, track variances, and deliver actionable insights across your business.

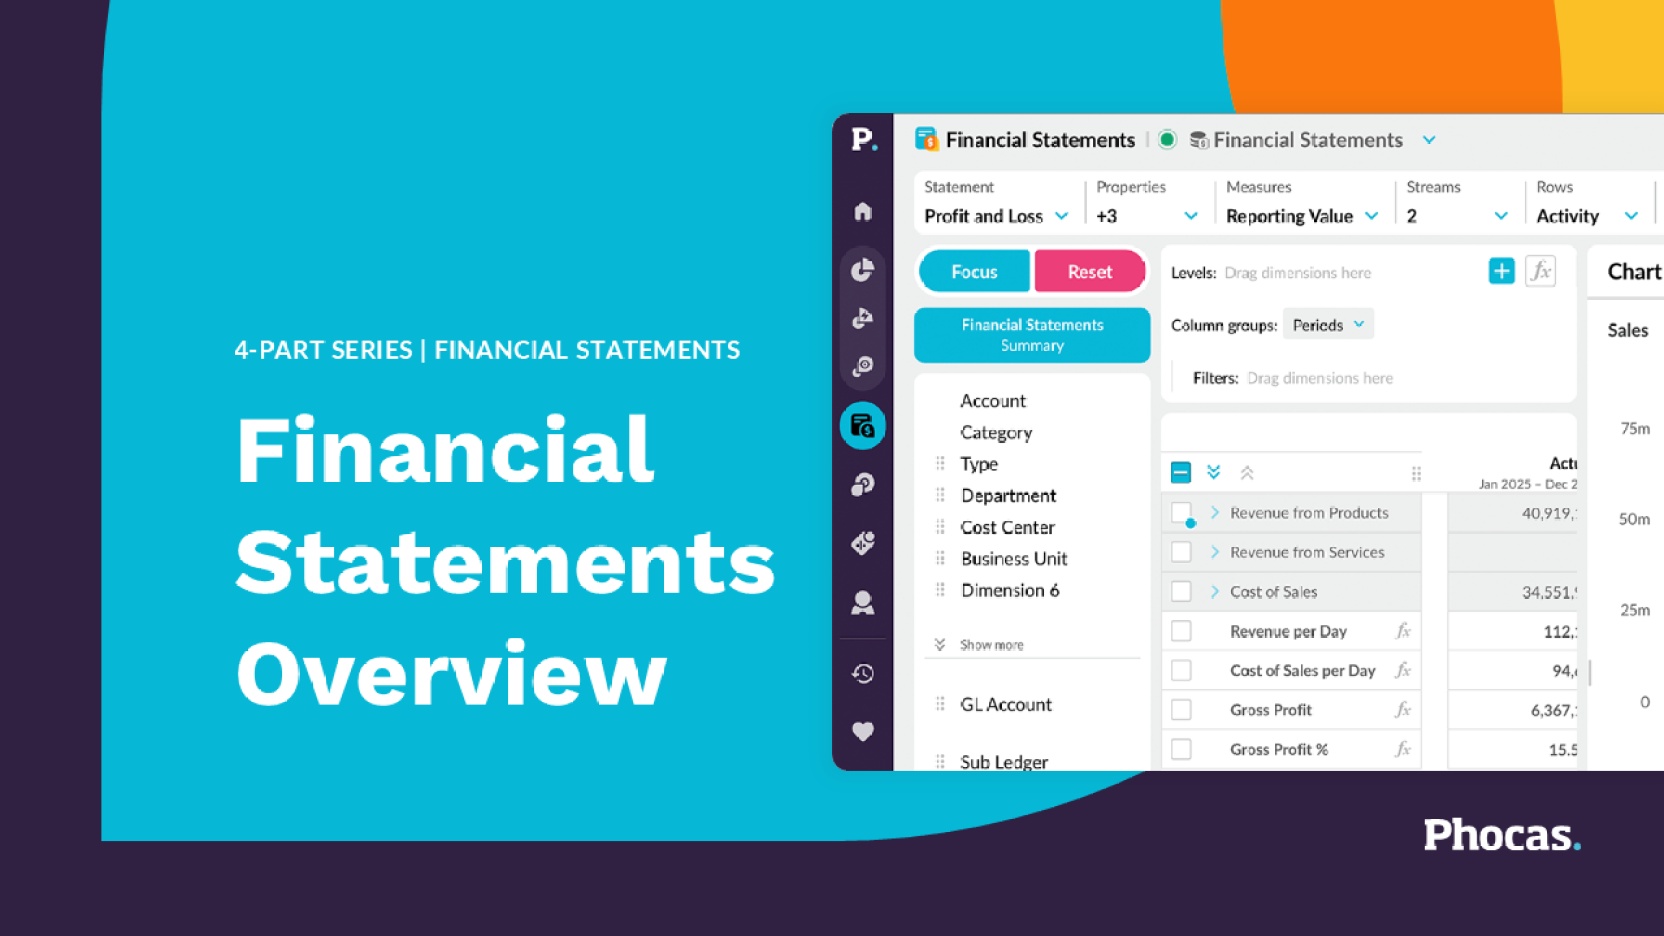
Financial Statements Overview
Now on-demand
Build a strong foundation in Financial Statements to confidently analyze and report on financial performance across your business.
Watch now

Phil Braniff
Customer Success Consultant

Katie Horgan
Product Marketing Manager
In this session, learn how to:
- Navigate the grid and analyze financial data across multiple entities
- Compare performance against budgets or prior periods to identify variances
- Customize financial statements to meet your specific reporting needs
- Apply filters and drill-downs to uncover deeper insights
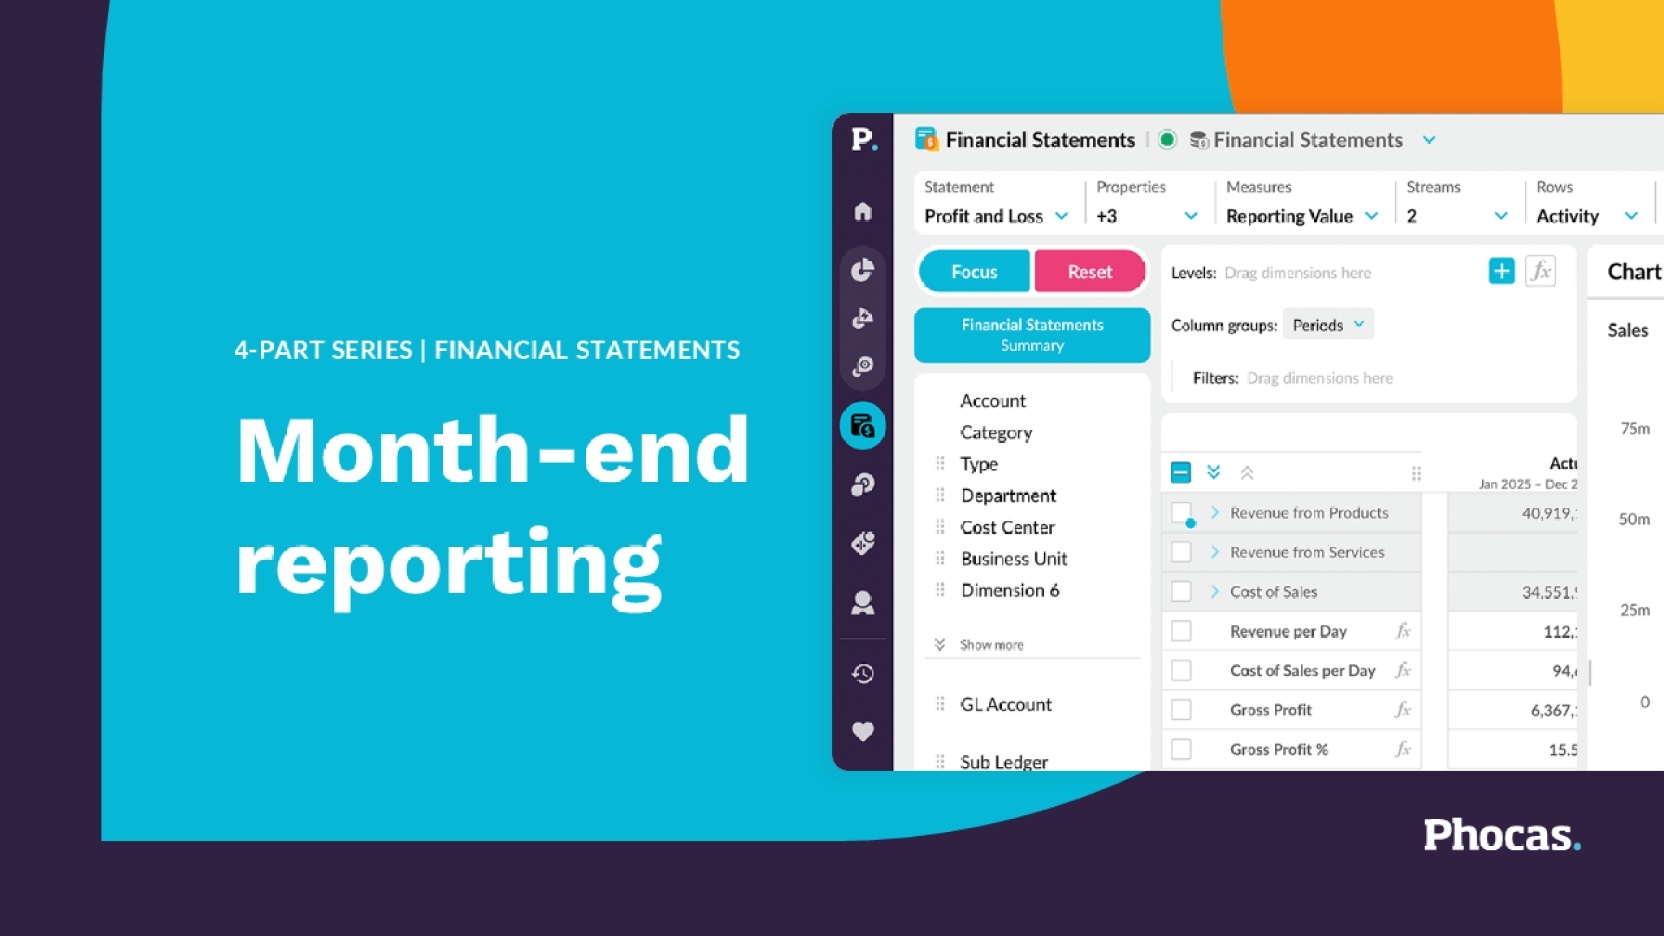
Month-end reporting
Now on-demand
Learn how to streamline your month-end close process and deliver accurate, timely financial reports with less manual effort.
Watch now

Kieran Taylor
Customer Success Consultant
Katie Horgan
Product Marketing Manager
In this session, we’ll cover how to:
- Automatically consolidate intercompany transactions to save time and reduce errors
- Drill down to journal entry level for quick verification and validation
- Compare perform side-by-side across branches, entities, and periods
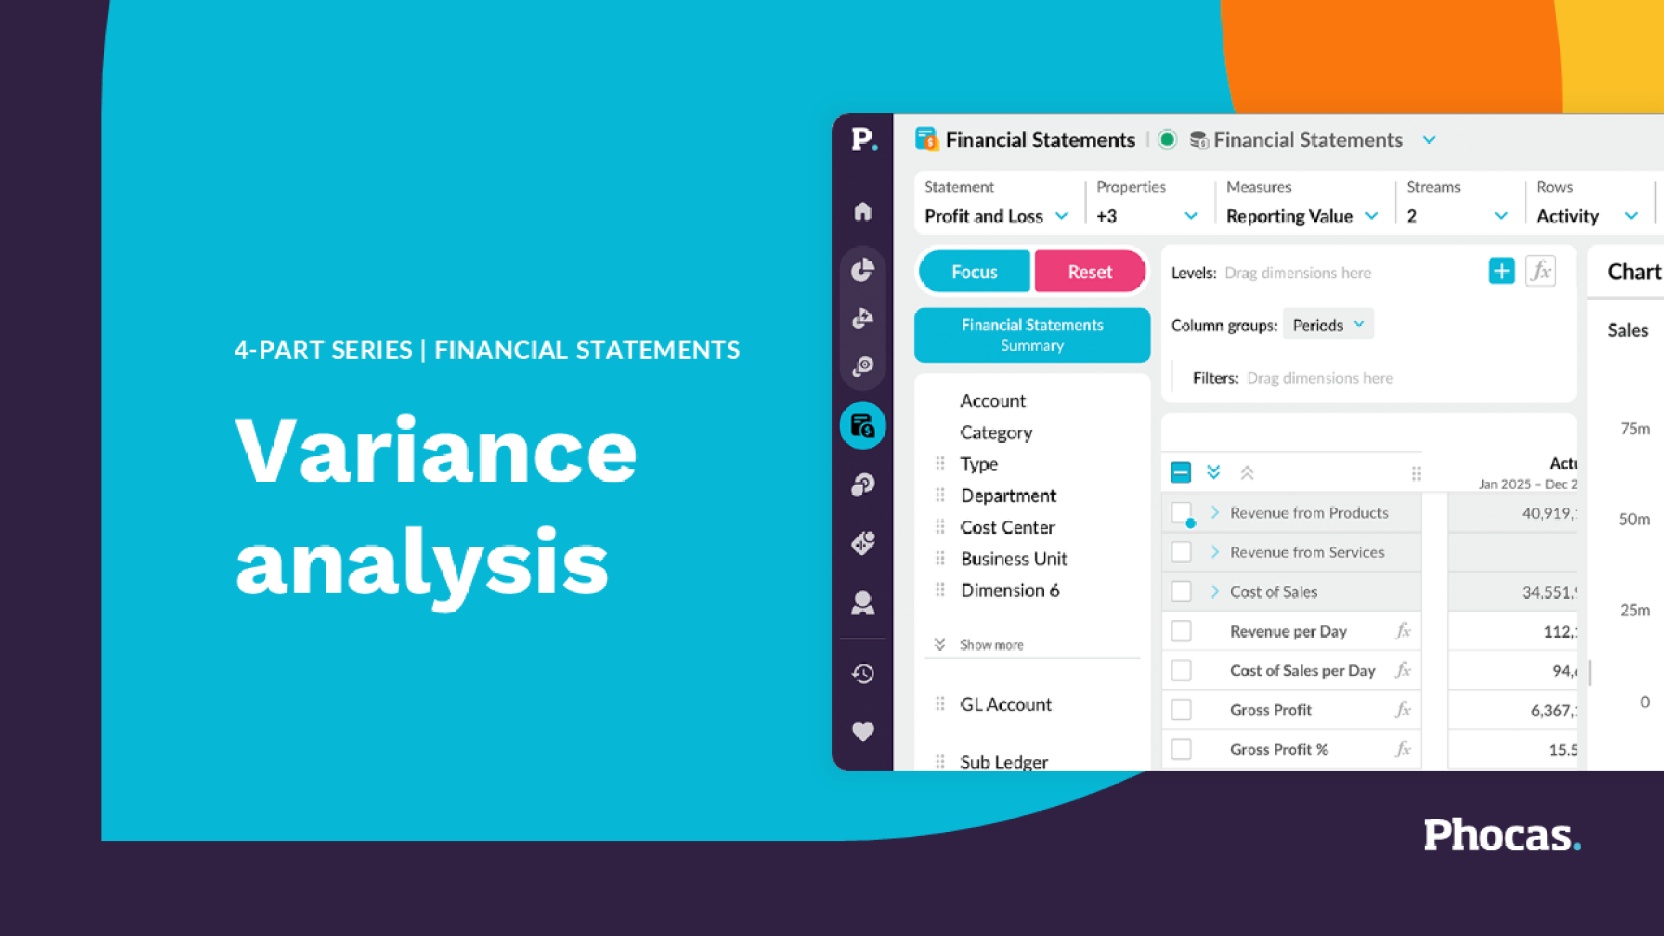
Variance analysis
Now on-demand
Discover how to track performance and identify the drivers behind financial changes to make informed decisions faster.
Watch now

Brenna Dwyer
Customer Success Consultant
Katie Horgan
Product Marketing Manager
In this session, learn how to:
- Build variance dashboards to monitor budget vs actual performance
- Track KPIs and trends over time to spot patterns early
- Drill down to transaction level to attribute changes and understand variances
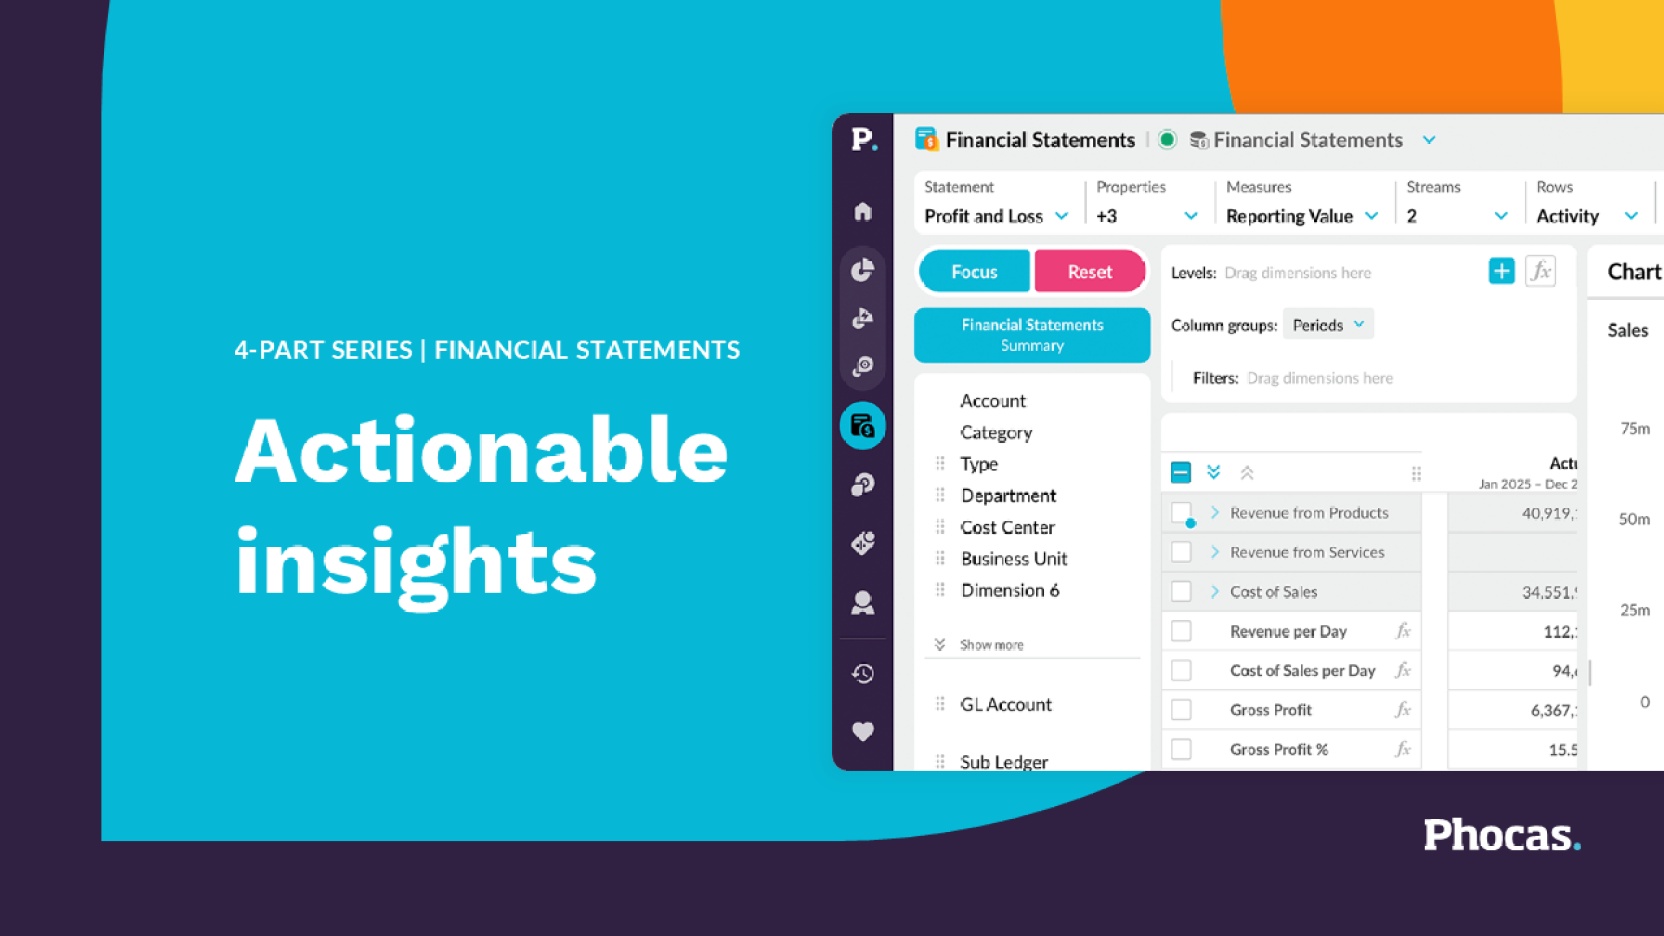
Actionable insights
Now on-demand
See how to transform financial data into visualizations that drive business action and decision-making.
Watch now

Alex West
Technical Pre-sales Consultant
Katie Horgan
Product Marketing Manager
In this session, learn how to:
- Combine financial and operational data for complete business visibility
- Create visual KPI scorecards for at-a-glance performance monitoring
- Build professional, shareable reports for executives and board packs
- Configure automated report distribution to keep stakeholders informed
You might also like
View all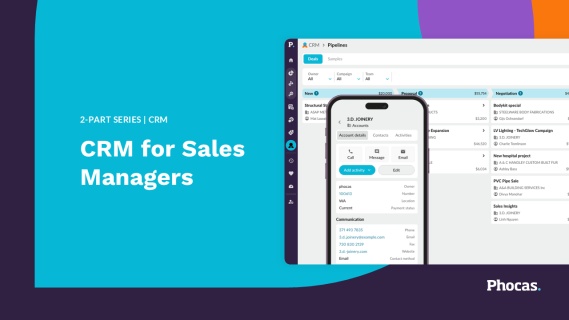
Special Edition: CRM
Phocas CRM has had a significant update — new design, mobile-first layout, AI Voice logging, and a direct connection to Sales Insights. This special edition PUG training runs over two sessions, one for sales managers and one for reps, built to show you how to get the most out of what's new, in the context of how you actually work.
Learn more
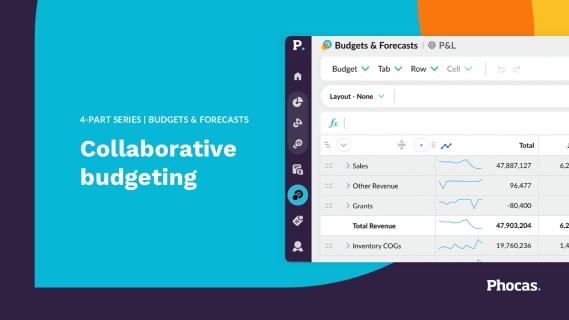
Budgets & Forecasts
Join our 4-part Phocas User Group (PUG) training series and take your budgeting and forecasting to the next level. From setting up your first budget workbook and managing workflows, to connecting your P&L, balance sheet, and cashflow; and using that complete model to stress-test your assumptions and plan for what's ahead.
Learn more
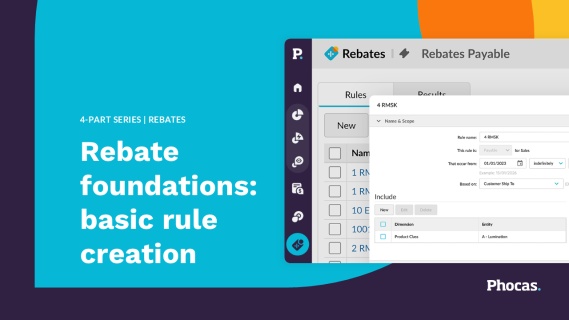
Rebates
This 4-part Phocas User Group (PUG) series is designed to help you master rebate management. Learn how to automate calculations, gain full visibility into supplier and customer programs, and identify near-miss opportunities that maximize profitability. Move beyond manual spreadsheets to strategic insights that protect margins and drive growth.
Learn more
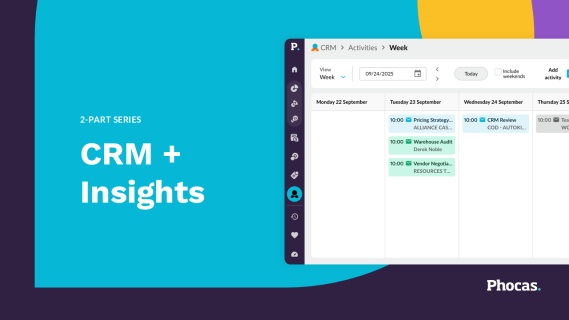
CRM + Insights
This 2-part Phocas User Group (PUG) series is designed to help sales teams unlock the full potential of CRM and Insights to drive smarter, more proactive selling. Whether you're leading a team or managing your own pipeline, you'll learn how to use data to stay ahead of customer needs, streamline daily workflows, and focus on what matters most. Even if you're not currently using CRM or Insights, we encourage you to attend and explore how these tools can help you and your team sell smarter and faster.
Learn more