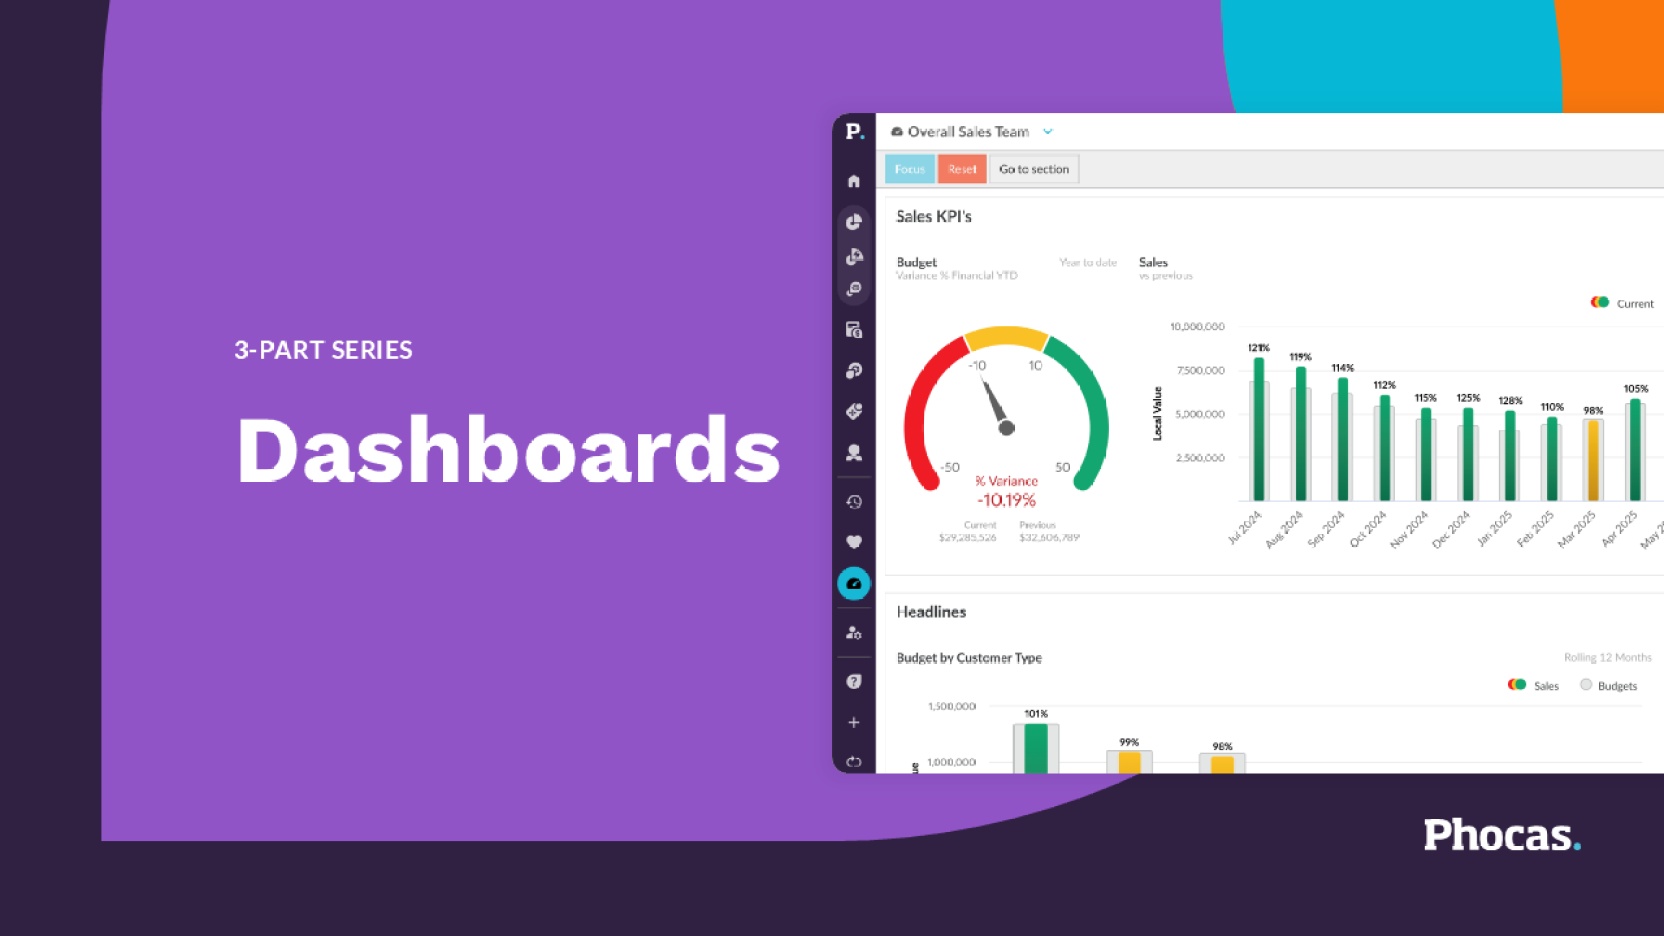
Dashboards
3 sessions in this series
Build dashboards that support faster, more confident decisions in our 3-part Phocas User Group (PUG) training series. Learn how to create dynamic dashboards that track sales and inventory KPIs, analyze customer and product trends, and bring together insights from multiple databases like Sales, Inventory, and CRM. Whether you're just getting started or ready to go deeper, this series will help you move beyond static reports and create a single, strategic view of your business.
Dashboards 101
Now on-demand
Build a dashboard from scratch to visualize your data and turn it into clear, actionable insights.
Watch now

Stephanie Randall
Customer Success Consultant

Katie Horgan
Product Marketing Manager
In this session, we'll cover how to:
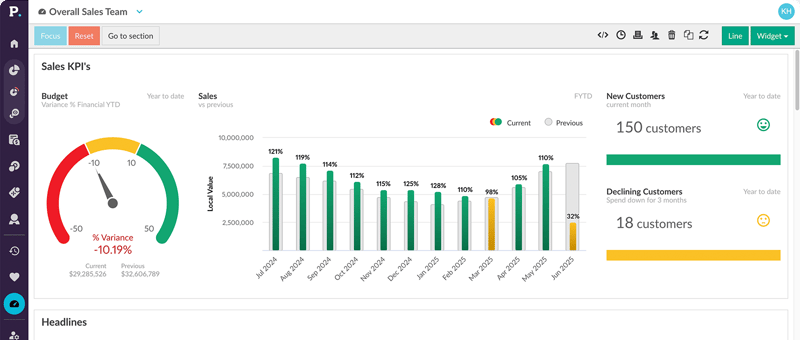
- Create a dashboard that brings together KPIs in one interactive view
- Customize widgets to reflect your team’s key business metrics — like revenue or customer performance
- Use filters to tailor dashboards for different roles, such as sales reps and branch managers
- Track important metrics like revenue vs. Budget and sales by customer

Building advanced dashboards
Now on-demand
Building on session 1, we’ll help take your dashboarding skills to the next level by focusing on layout design for greater impact — highlighting key trends in customer retention, product performance, and sales gaps.
Watch now

Madison Siniard
Customer Success Consultant
Katie Horgan
Product Marketing Manager
In this session, learn how to:
- Dig deeper into widget options to highlight trends like declining customers and gap analysis
- Personalize your dashboard with images, videos, and links to tell a clearer story with your data
- Make your dashboard the hero of your homepage so key insights are front and center for your team

Multi-database dashboarding
Now on-demand
Build a dashboard that combines data from multiple databases like Sales, Inventory, and CRM together in one powerful view so you can uncover deeper insights.
Watch now

Paul Koch
Customer Success Consultant
Katie Horgan
Product Marketing Manager
This session covers how to:
- Create dashboard lines for different business areas like Sales, Inventory, and CRM
- Use widgets to track key operational metrics like stock on hand and weeks cover
- Filter and drill into data across multiple databases in one dashboard
You might also like
View all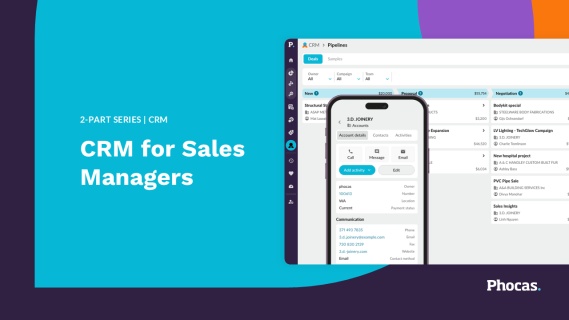
Special Edition: CRM
Phocas CRM has had a significant update — new design, mobile-first layout, AI Voice logging, and a direct connection to Sales Insights. This special edition PUG training runs over two sessions, one for sales managers and one for reps, built to show you how to get the most out of what's new, in the context of how you actually work.
Learn more
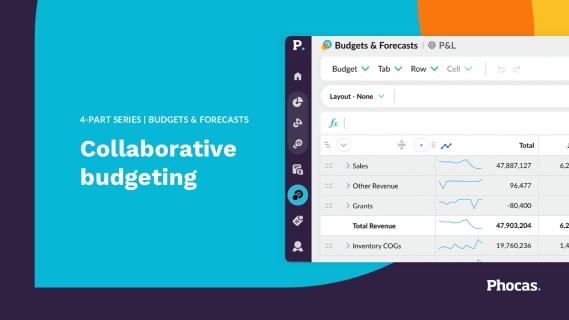
Budgets & Forecasts
Join our 4-part Phocas User Group (PUG) training series and take your budgeting and forecasting to the next level. From setting up your first budget workbook and managing workflows, to connecting your P&L, balance sheet, and cashflow; and using that complete model to stress-test your assumptions and plan for what's ahead.
Learn more
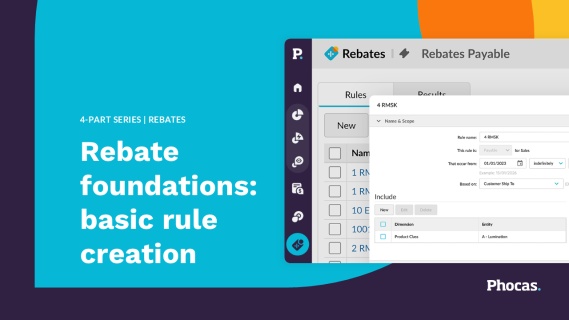
Rebates
This 4-part Phocas User Group (PUG) series is designed to help you master rebate management. Learn how to automate calculations, gain full visibility into supplier and customer programs, and identify near-miss opportunities that maximize profitability. Move beyond manual spreadsheets to strategic insights that protect margins and drive growth.
Learn more
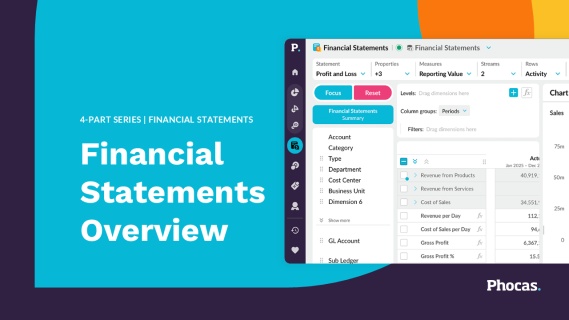
Financial Statements
This 4-part Phocas User Group (PUG) series is designed to help finance teams unlock the full potential of Financial Statements. Learn how to analyze performance, streamline month-end reporting, track variances, and deliver actionable insights across your business.
Learn more