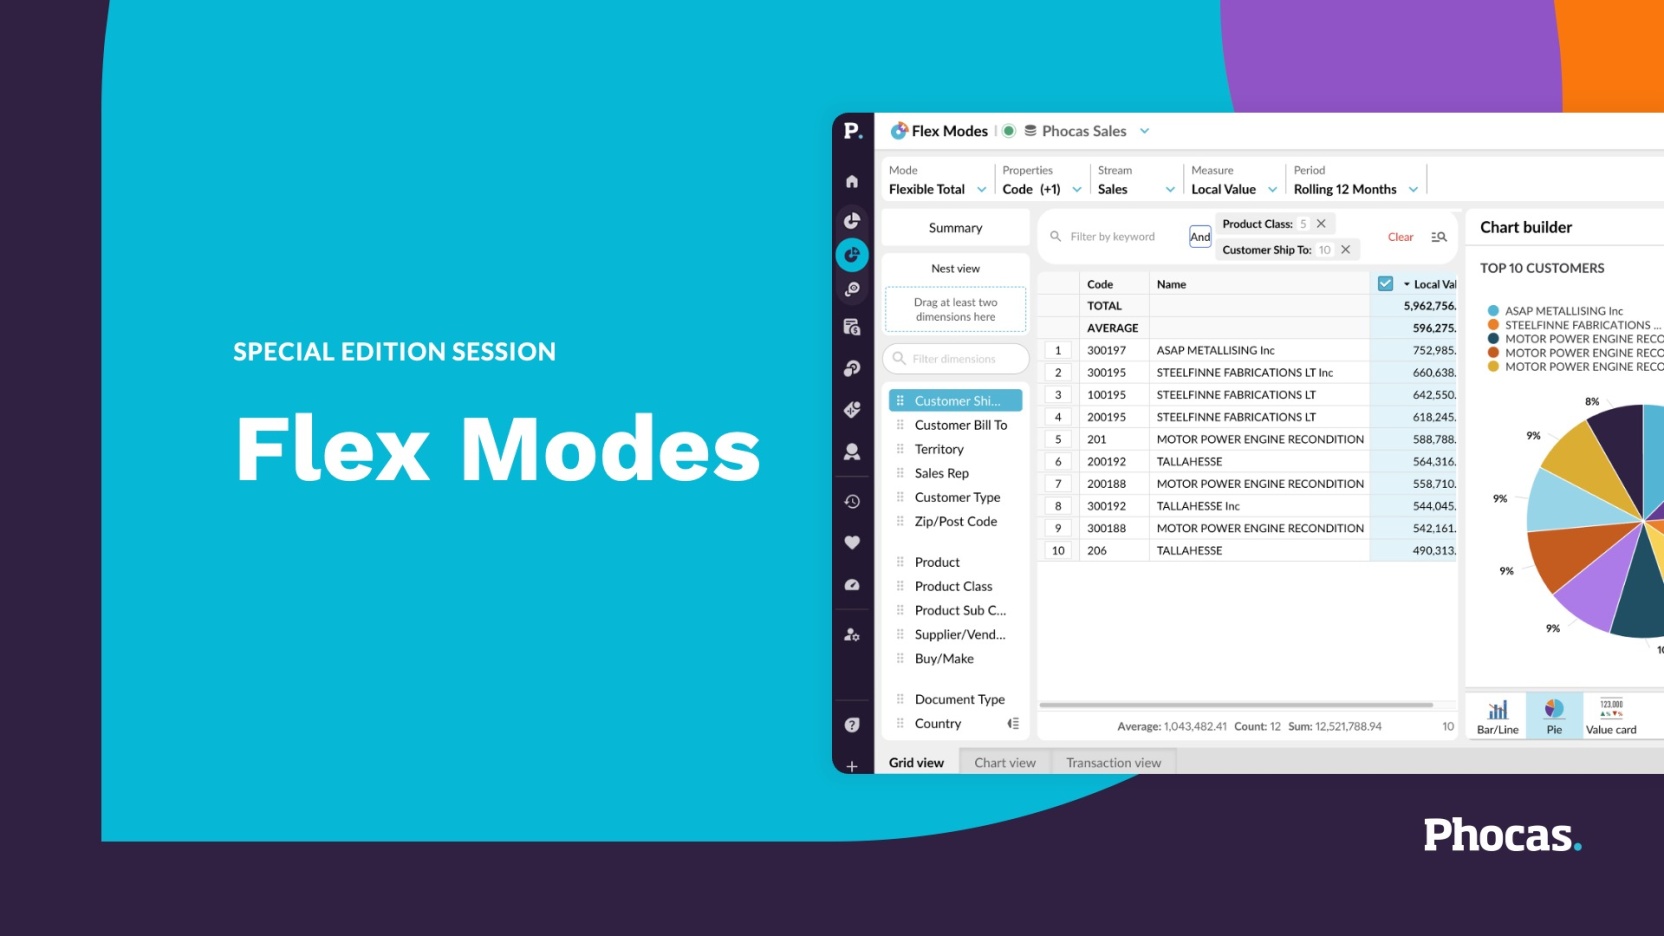
Flex Modes
Special edition training session
Richer and more flexible ways to explore variances, totals and trends over time.
Flex Modes
Now on-demand
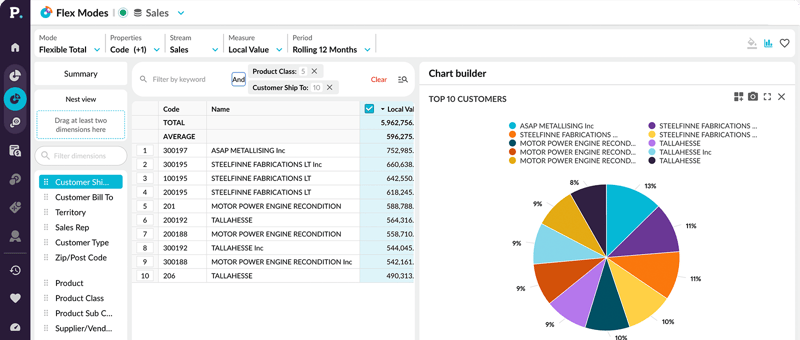
Whether you're building complex queries, spotting outliers, or switching between high-level metrics and individual transactions, Flex Modes extends the current functionality of Analytics.
Watch now

Harry Eldridge
Technical Pre-Sales Manager

Rebecca Ambrose
Head of Customer Marketing
In this session, we’ll walk you through why we built Flex Modes, what’s coming next, and how to start using it - including how to:
- Identify outliers in your data using any calculation or measure
- Easily switch between top-level numbers and individual transactions leveraging interconnected tabs for analysis, charts and transactions
- Use AND/OR advanced searches to filter data and get precise results
- Do complex calculations (including count measures)
You might also like
View all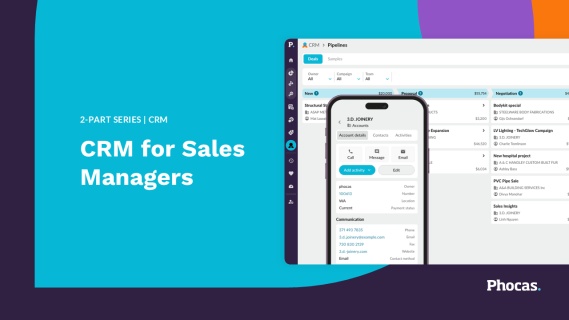
Special Edition: CRM
Phocas CRM has had a significant update — new design, mobile-first layout, AI Voice logging, and a direct connection to Sales Insights. This special edition PUG training runs over two sessions, one for sales managers and one for reps, built to show you how to get the most out of what's new, in the context of how you actually work.
Learn more
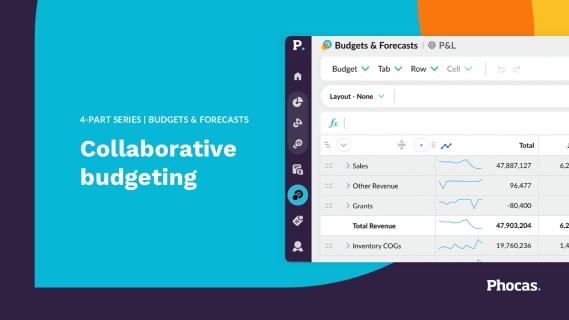
Budgets & Forecasts
Join our 4-part Phocas User Group (PUG) training series and take your budgeting and forecasting to the next level. From setting up your first budget workbook and managing workflows, to connecting your P&L, balance sheet, and cashflow; and using that complete model to stress-test your assumptions and plan for what's ahead.
Learn more
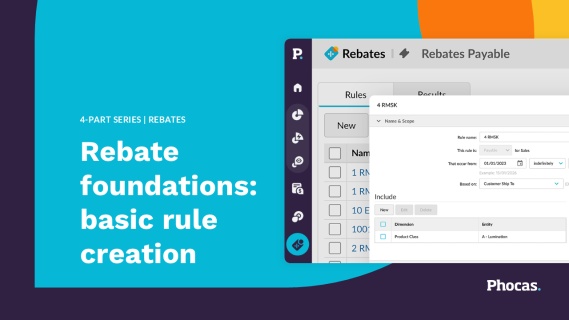
Rebates
This 4-part Phocas User Group (PUG) series is designed to help you master rebate management. Learn how to automate calculations, gain full visibility into supplier and customer programs, and identify near-miss opportunities that maximize profitability. Move beyond manual spreadsheets to strategic insights that protect margins and drive growth.
Learn more
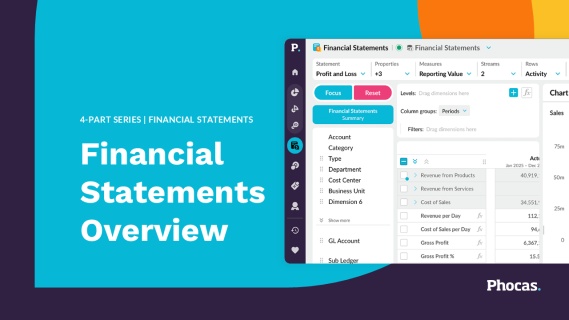
Financial Statements
This 4-part Phocas User Group (PUG) series is designed to help finance teams unlock the full potential of Financial Statements. Learn how to analyze performance, streamline month-end reporting, track variances, and deliver actionable insights across your business.
Learn more