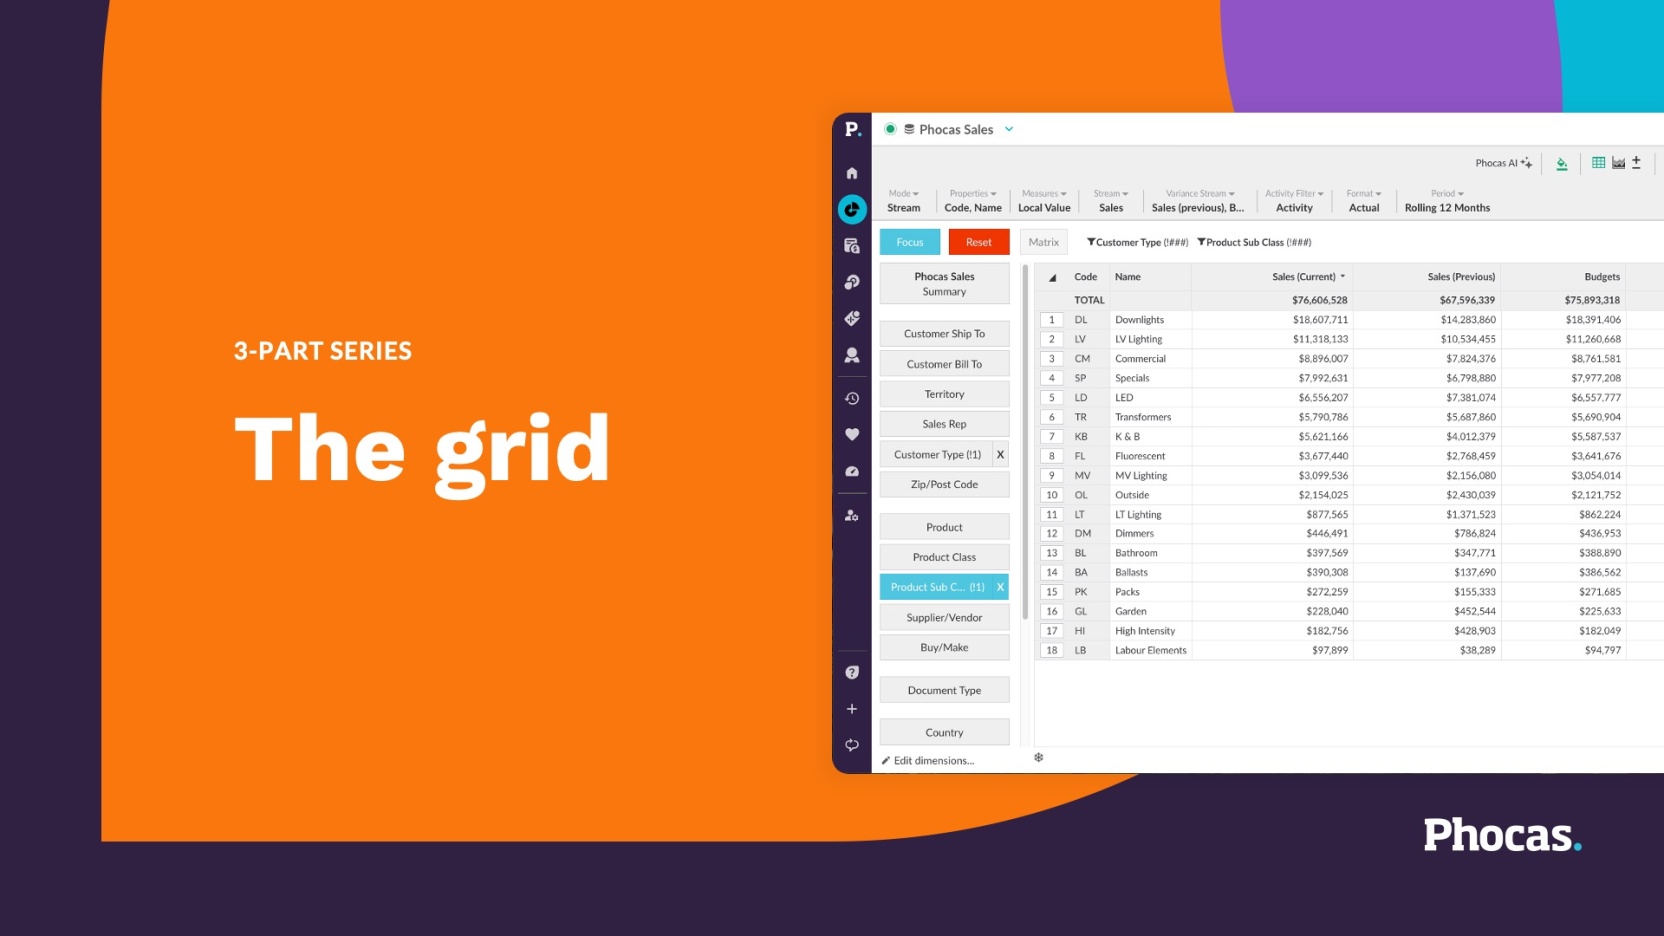
The Grid
3 sessions in this series
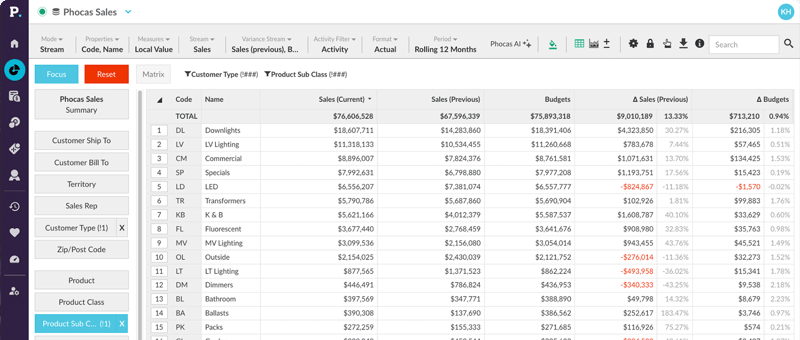
In this series, get comfortable navigating the Phocas grid to confidently analyze, report and leverage your data to drive business success.
Grid 101
Now on-demand
Master the Phocas Grid to track KPIs, compare performance, and uncover opportunities for sales and inventory optimization.
Watch now

Phil Braniff
Customer Success Consultant

Katie Horgan
Product Marketing Manager
In this session, learn how to:
- Confidently navigate the Grid to freely explore data and drive business success
- Easily identify gaps and opportunities across your customer channels by comparing sales against budget and previous period
- Track your KPIs against budget at multiple levels (e.g. by sales rep, customer, branch/location)

Advanced search + Phocas extras
Now on-demand
Expanding on Grid 101, we'll introduce advanced features that enable deeper data analysis to support better decision making.
Watch now

Imani Timpanaro
Customer Success Consultant
Katie Horgan
Product Marketing Manager
In this session, learn how to:
- Uncover sales and inventory opportunities by identifying low-margin products, inactive customers and slow-moving stock to drive targeted actions
- Refine analysis by filtering data streams, adding calculations, and setting up alerts to stay on top of key sales and inventory changes
- Enhance focus and reporting by locking dimensions for consistent customer or product views, using nested tables for deeper insights, and ensuring correct user access with impersonation

Custom reporting + gap analysis
Now on-demand
Customize calculations, apply edits, and arrange columns to uncover deeper insights into sales and inventory—enhancing performance and improving stock control.
Watch now

Carl Jones
Customer Success Consultant
Katie Horgan
Product Marketing Manager
Using custom and matrix mode, learn how to:
- Customize the way you display columns in the grid for more detailed analysis
- Build custom calculations to identify opportunities and track sales + inventory performance
- Adjust reports with dynamic offset dates to keep your sales and inventory data up to date
You might also like
View all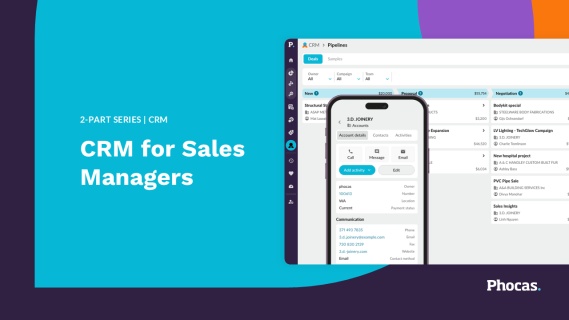
Special Edition: CRM
Phocas CRM has had a significant update — new design, mobile-first layout, AI Voice logging, and a direct connection to Sales Insights. This special edition PUG training runs over two sessions, one for sales managers and one for reps, built to show you how to get the most out of what's new, in the context of how you actually work.
Learn more
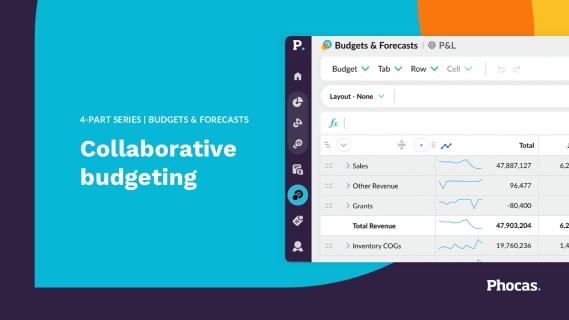
Budgets & Forecasts
Join our 4-part Phocas User Group (PUG) training series and take your budgeting and forecasting to the next level. From setting up your first budget workbook and managing workflows, to connecting your P&L, balance sheet, and cashflow; and using that complete model to stress-test your assumptions and plan for what's ahead.
Learn more
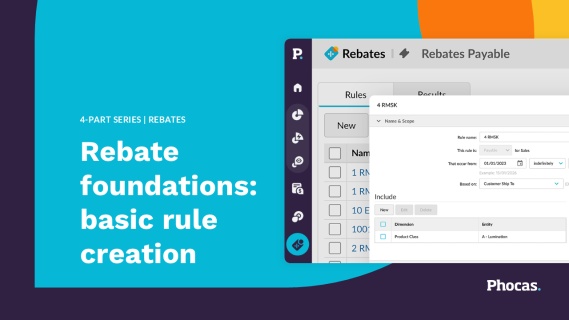
Rebates
This 4-part Phocas User Group (PUG) series is designed to help you master rebate management. Learn how to automate calculations, gain full visibility into supplier and customer programs, and identify near-miss opportunities that maximize profitability. Move beyond manual spreadsheets to strategic insights that protect margins and drive growth.
Learn more
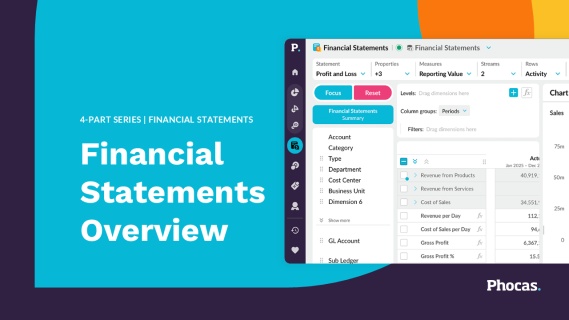
Financial Statements
This 4-part Phocas User Group (PUG) series is designed to help finance teams unlock the full potential of Financial Statements. Learn how to analyze performance, streamline month-end reporting, track variances, and deliver actionable insights across your business.
Learn more