All about leverage ratios
If you want to play chess - you need to know the classic opening moves and likewise to succeed in finance, it also helps to know important financial ratios like all the main leverage ratios.
Leverage ratios (also known as solvency ratios) allow you to determine your company’s financial risk and are a way of determining a company’s long-term debt relative to total equity. Most lenders will use leverage ratios to assess the potential risk of a company before deciding to lend to them.
Leverage ratios vs liquidity ratios
Leverage ratios look at total liabilities , a company’s capital structure and long term solvency of an organization. While liquidity ratios compare short-term debt and assets that can be quickly converted into cash - measuring the of short term viability of a company.
Why leverage ratios matter?
Most companies rely on both equity and debt to finance operations. Leverage ratios provide a view of the level of debt a business is carrying. They answer the all-important question, “Does the organization have the cashflow to service and repay the debt?”
Lenders often use leverage ratios to help them assess an organization’s funding risk. As ratios improve or deteriorate, it can directly affect the interest rates an organization will be charged.
A higher or increasing leverage ratio may mean that your business is using more debt to finance assets and operations, and will eat away at profitability — which could indicate that it’s on shaky financial footing. Conversely, a lower ratio typically shows a company with low financial risk and less risk to lenders and investors.
These ratios are also an important metric for shareholders and management to understand their financial obligations and the sweet spot for high leverage. Because debt borrowing can improve shareholder returns, shareholders may be pleased to learn your organization is operating with a reasonable degree of leverage.
Management, of course, can use its understanding of leverage ratios to make critical decisions about the amount of debt the company is carrying and whether any adjustments need to be made to lower risk or increase debt to grow or make new investments.
What are the common types of leverage ratios?
The various leverage ratios available can offer different insights depending on what you’re looking to measure.
These are the most commonly used leverage ratios:
Debt ratio or Debt to assets ratio: Total debt-to-total-asset is calculated as total borrowings divided by total assets. Measures the percent of assets that are being financed with borrowings.
Debt to equity ratio: Calculated as total borrowings divided by shareholder equity. Measures the weight of borrowings against shareholder equity.
The debt to capital ratio: Calculated by dividing a company's total debt by its total capital, which is total debt plus total shareholders' equity.
Interest coverage ratio: Calculated as EBIT (Earnings Before Interest and Tax) divided by interest. Measures how many times the company can cover interest expense out of earnings.
Debt to EBITDA ratio or operating leverage ratio: (Earnings before interest, tax, depreciation, and amortization) ratio: Calculated as debt divided by EBITDA. Measures the amount of earnings that is available to payback debt before paying interest and tax.
How to use these ratios for maximum value
Understanding leverage ratios provides critical insights into the financial health of your business. Although it can be useful to calculate these ratios on their own, they can deliver much more meaningful insights when tracked and studied as a group over time so you can determine if higher returns can be achieved with or without higher leverage ratios.
Phocas Financial Statements allows you to customize your income statements and balance sheet and add in custom calculations, such as debt-to-assets ratio and debt to EBIDTA ratio.
You can line these metrics up side by side and select a monthly view to observe the trends over time. Additionally, you can compare a data set to another period of your choosing helping to communicate the company’s ability to service the company’s debt. As your numbers shift in real-time, the data in the financial statement updates automatically — unlike in static reporting, where you’d have to make the changes manually to see the changes in interest payments or debt obligations.
Knowing your company’s financial leverage ratios helps you determine how much debt your company is carrying and how much wiggle room you have — in other words, how much debt you can continue to take on and still meet the terms of your financial covenants.
To learn more about how Phocas’s financial solutions can maximize the value of your company's financial ratios, download the ebook below
Companywide financial planning and analysis
Download now


Using her 15 years+ experience as a CA, Jordena helps Phocas develop financial products that save time and provide ways to extend analysis and performance.
Related blog posts

Aktion Associates has been named FY26 North America Partner of the Year in the inaugural Phocas Partner Awards, following 90% year-over-year growth. A leading North American ERP and business technology partner to mid-market companies in architecture, engineering, construction, distribution and manufacturing, Aktion has worked with Phocas for six years to help customers see business performance more clearly and make more informed decisions.
Read more
Kilimanjaro Consulting has been named the APAC winner of the inaugural Phocas Partner Awards. Kilimanjaro has grown customer value year-over-year, with 30% of existing customers extending their use of Phocas.
Read more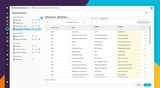
Mapping your general ledger accounts to a financial statement is one of those jobs everyone in finance knows and nobody wants to mess up. Whether you call it account mapping, GL mapping or GL coding, it is matching every account in your chart of accounts, line by line, to the right row on the P&L (income statement), balance sheet or cash flow. Miss one account or mis-map another and the numbers don't reconcile. Get it right and it takes hours but it is longer again if you're rolling the work out across multiple entities, branches or depots. Phocas Financial Statements has just added two features that change this. A Statement Library of ready-to-use report templates and AI-suggested account mapping with confidence scoring. Together, they turn an important manual setup task into something you can replicate and trust.
Read more
When the results of the largest, global BARC The Planning Survey 2026 came in, the numbers that stood out most were outcomes. 100% of surveyed Phocas users achieved a better quality of planning results. 100% reported product satisfaction and 91% said they would definitely or probably recommend Phocas to another organization.
Read moreBrowse by category
Find out how our platform gives you the visibility you need to get more done.
Get your demo today