Home Academy Learning modules

Phocas Analytics QuickStart

9:55 minutes total learning time
This module for beginners takes you through getting started in Phocas Analytics and doing some simple analysis to get fast results from your data. These videos introduce you to features that you will be using every day.
7 videos in this learning module
1
Find your way around Phocas
2:05
2
Explore the analysis grid
1:53
3
Compare data with matrix mode
0:55
4
Explore charts
1:09
5
Save useful data as a favorite
0:48
6
Homepage at a glance
2:11
7
Drill into your data with the 'Focus' button
0:54
Find your way around Phocas
Explore the analysis grid
Compare data with matrix mode
Explore charts
Save useful data as a favorite
Homepage at a glance
Drill into your data with the 'Focus' button

Find your way around Phocas

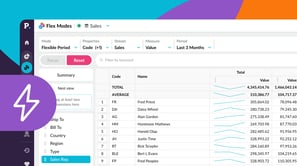
Learn how to quickly find all your important tools and data, perform common actions and find helpful resources, all from the Phocas side menu.

Supporting documentation

Explore the analysis grid

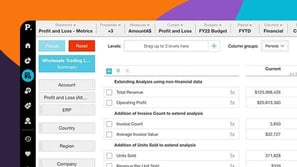
Here we show you how to get started in the Phocas analysis grid. Learn how to jump into your data from the home page, starting from a saved view or following your train of thought to change measures, date ranges and other views.

Supporting documentation

Compare data with matrix mode

Learn how to compare sales performance of regions, branches or products side-by-side with a simple matrix tool.

Supporting documentation

Explore charts

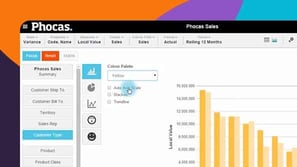
In this Phocas Analytics video, Karen gives an overview of some of the ways to see trends at a glance with a chart or graph.

Supporting documentation

Save useful data as a favorite

Save useful analysis points, data views and charts as favorites for quick access at any time.

Supporting documentation

Homepage at a glance

Learn how to make the most of your homepage - the starting point to easily find databases, dashboards, favorites and recents.

Supporting documentation

Drill into your data with the 'Focus' button

In this video Karen takes a look at how to use the Focus button to isolate selected data and drill further into data to answer your analysis questions.

Supporting documentation

Phocas product
Analytics Analytics
Phocas Software help and support
Help & support

Have questions or need to report an issue with a Phocas product?

Get support

Related learning modules

Grid customization basics
Analytics Analytics

Grid customization basics

Want another way of looking at things? This module for beginners covers simple methods of customizing your view in the analysis grid.
5 videos
7:39 min
Turn data into a chart
Analytics Analytics

Turn data into a chart

Switching from grid to chart view opens up options for various graphical presentation of your data. This module covers basic chart setup through to advanced configuration, with a detailed look at some chart types.
5 videos
11:34 min