Flex Modes QuickStart
This beginner-friendly module walks you through getting started in Flex Modes and shows you how to run simple analyses for quick insights. Learn how to explore your data with Flex Modes and see how the different modes and features give you the flexibility to view, compare, and analyze your information in ways that work best for you.
6 videos in this learning module
Take a tour of Flex Modes
Filter data in Flex Modes
Compare data in a matrix in Flex Modes
Create a nested view in Flex Modes
Apply conditional formatting in Flex Modes
Create an advanced filter in Flex Modes


6 videos in this learning module
Take a tour of Flex Modes
Filter data in Flex Modes
Compare data in a matrix in Flex Modes
Create a nested view in Flex Modes
Apply conditional formatting in Flex Modes
Create an advanced filter in Flex Modes
Take a tour of Flex Modes
Learn how to explore your data with Flex Modes, and see how the different modes and features give you greater flexibility in how you view, compare, and analyze your information.
Supporting documentation
Filter data in Flex Modes
Supporting documentation
Compare data in a matrix in Flex Modes
Learn how to filter and pivot rows at the same time, letting you view two dimensions side by side in a matrix. This makes it easy to compare your data and quickly spot any differences.
Supporting documentation
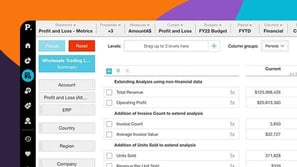
Create a nested view in Flex Modes
With the nest view feature in Flex Modes, you can add dimensions as levels in the grid, making your data easier to interpret. This lets you see how different items contribute to the overall results and build reports where you define the hierarchy of the data on display.
Supporting documentation
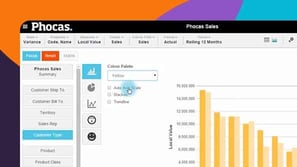
Apply conditional formatting in Flex Modes
Supporting documentation
Create an advanced filter in Flex Modes
Learn how to use the Advanced Filter to take your analysis further and answer more complex questions. It’s a powerful way to refine your search results and uncover deeper insights in your data.
Supporting documentation

Related learning modules
Phocas Analytics QuickStart
Grid customization basics