Visualize financial information
11:05 minutes total learning time
Learn how you can use visualizations to explore financial statements, highlight key performance, and develop a clearer understanding of your financial position.
Phocas product  Financial Statements
4 videos in this learning module
1
View financial information in a chart
2:37
2
Add financial analysis to a dashboard
2:24
3
Highlight financial performance using a waterfall chart
3:35
4
Explore and view dashboards
2:29


4 videos in this learning module
1
View financial information in a chart
2:37
2
Add financial analysis to a dashboard
2:24
3
Highlight financial performance using a waterfall chart
3:35
4
Explore and view dashboards
2:29
View financial information in a chart
Learn how to use charts to visually explore and interact with your financial information and spot trends at a glance.
Supporting documentation
Add financial analysis to a dashboard
Add the views and visualizations you use often to a dashboard for quick and easy insights.
Supporting documentation
Highlight financial performance using a waterfall chart
This video shows how to use a waterfall chart to highlight financial performance over time, and use the chart in matrix mode to see how entities have contributed to that performance.
Supporting documentation
Explore and view dashboards
Discover just how user-friendly a Phocas Financial Statemetns dashboard can be! Learn how to make simple selections, narrow your focus, clear filters, and reset the dashboard with ease.
Supporting documentation
Phocas product

Related learning modules

Get started with Financial Statements
This module for beginners helps you get started in Phocas Financial Statements. Learn about the grid, layouts and charts and how to add a favorite view to your dashboard.
6 videos
12:44 min

Explore and analyze financial information
Discover how you can change statement views, apply filters, add detail, and drill down into your data to move smoothly from a high-level overview to detailed insights for deeper analysis.
4 videos
7:23 min
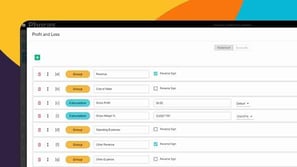
Create and manage financial statements
Learn how you can customize financial statement layouts and contents to fit your organization's needs by adding, removing, and reordering items.
10 videos
35:23 min
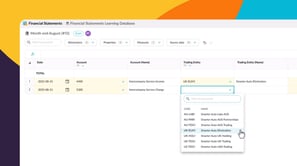
Add data to your financial statements
COMING SOON – This module introduces the Journals feature in Financial Statements: a simple, flexible tool for entering debit and credit-style journal entries for tasks like intercompany eliminations and management reporting adjustments. You’ll learn how to make quick manual adjustments between entities, publish them back to your financial statements, and streamline workflows when managing multiple ERPs or using Excel.
3 videos
8:38 min