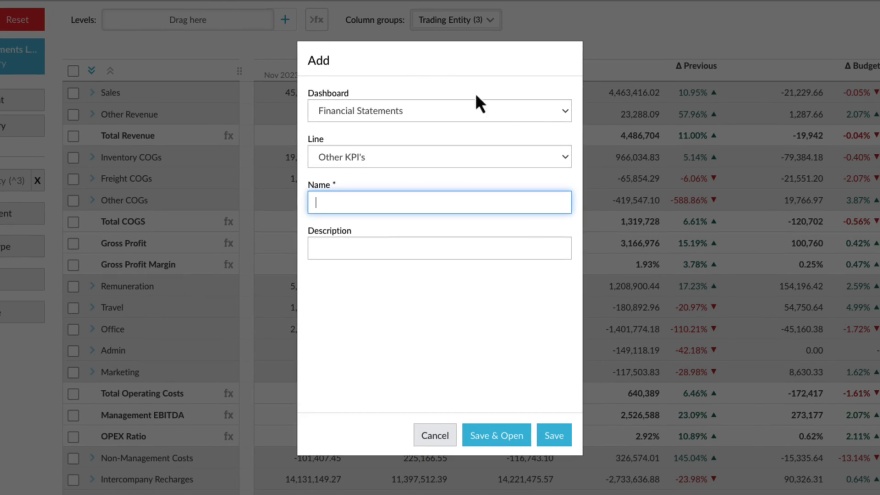
Add key financial metrics to your dashboard
6:57 min
Management accountants and anyone close to their business's key financial metrics will benefit from this video, which shows how to keep these figures top of mind by adding them a dashboard. Here Dan, a Chartered Accountant, takes you through creating a quick visualisation without leaving the statement, applying some conditional formatting and adding your marker to a dashboard to share with others.

Presented by Dan Harrison
Chartered Accountant and industry expert
Phocas product
Category
Role
Related video tutorials
Save useful data as a favorite
Save useful analysis points, data views and charts as favorites for quick access at any time.
0:48 min
Highlight financial performance using a waterfall chart
This video shows how to use a waterfall chart to highlight financial performance over time, and use the chart in matrix mode to see how entities have contributed to that performance.
3:35 min
View financial information in a chart
This video shows how to open the chart pane, configure a chart and add a chart to a dashboard.
1:49 min
Summary charts 2
Use a summary chart to turn a favorite into a simple color-coded dashboard widget. See Andy's 'Summary charts 1' video in the Charts module to learn how to create a summary chart widget from scratch.
2:15 min