Take a tour of Analytics
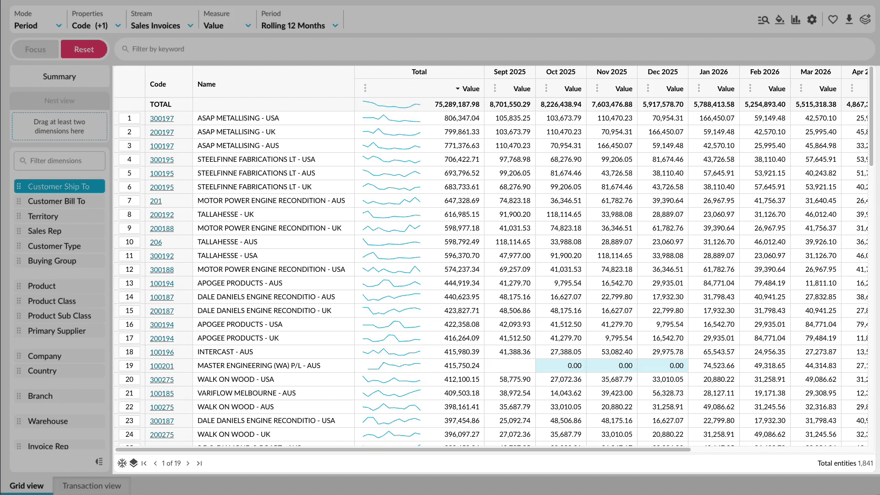
Learn how to find your way around Analytics and shape your view to answer the question you have. You'll see how the toolbar, dimensions panel, filter bar, and grid work together, and how to focus on data, filter it, nest dimensions, and open the transactions behind a result.
Supporting documentation

Related video tutorials
 Analytics
Switch modes
Learn how to change how data appears in the grid by switching between Period, Variance, Stream, Total, and Transaction modes. You'll also move between Summary and Dimension views, and see how your selections and filters carry across, so you can compare the same analysis in different ways.
 Analytics (Classic)
Change the mode
Learn how modes work as predefined views that show particular columns in the grid. Switch from the default period mode to Variance to compare current and previous period performance side by side, or isolate a customer and use Transaction mode to see the individual transactions behind their results. Some modes, such as Variance, are only available when a dimension is selected and you're in a filtered view.
 Analytics
Know your weeks of cover
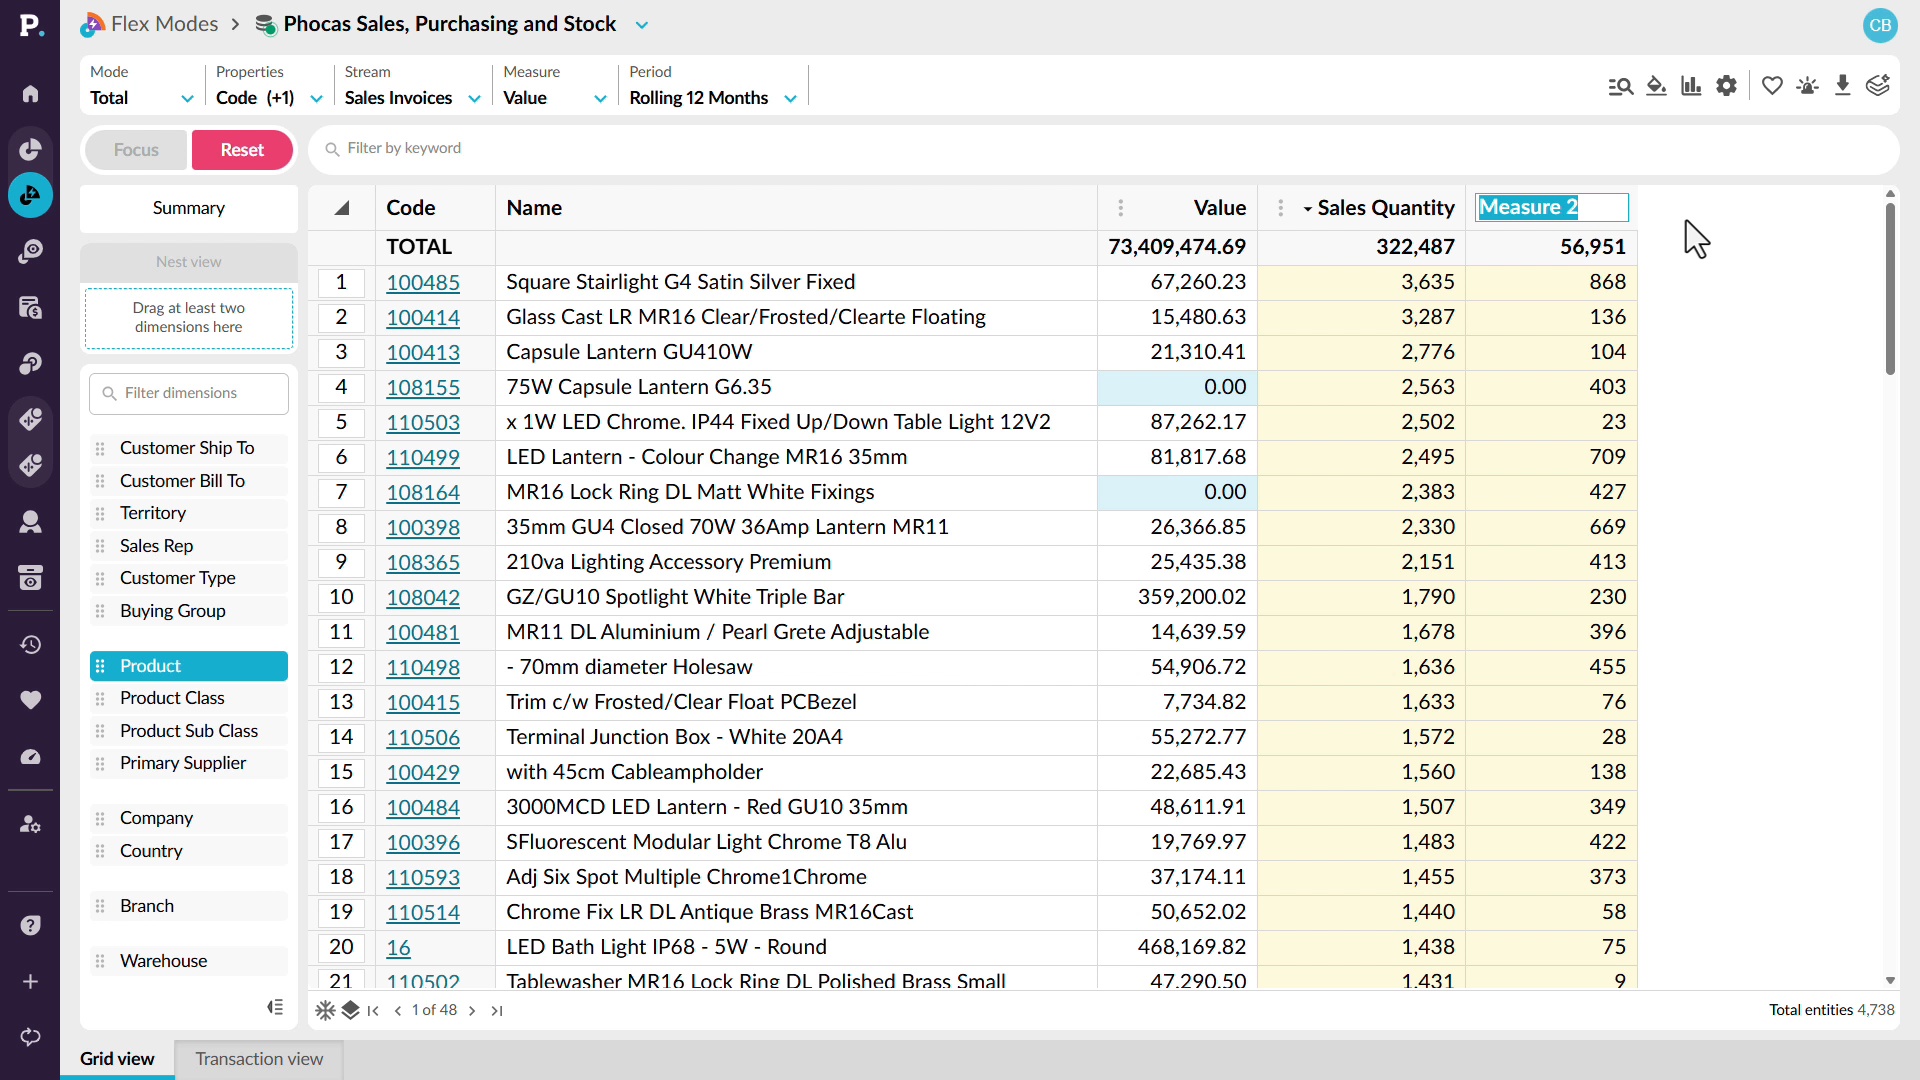
Learn how to work out your forward stock position by bringing sales quantity and stock on hand into one grid and building calculations that reference other columns, such as average monthly sales. You can duplicate a calculation to compare other periods, then save, send, or download the report, which updates as ERP data refreshes.
 Analytics
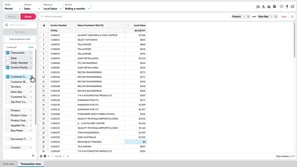
View transactions
Learn how to see the individual records behind your results, such as invoices. You'll compare Transaction view and Transaction mode, choose transaction and dimension properties as columns, nest by invoice number, search, filter, and add calculations to dig deeper.
