Track sales rep performance against budget

Learn how to bring a budget stream into your grid with stream mode and compare it to sales by country and sales rep. You'll sort the variance column to surface weaker performers, then shorten the period or switch to Period Mode to check individual months for patterns or anomalies that may need follow-up.
Supporting documentation

Related video tutorials
 Analytics
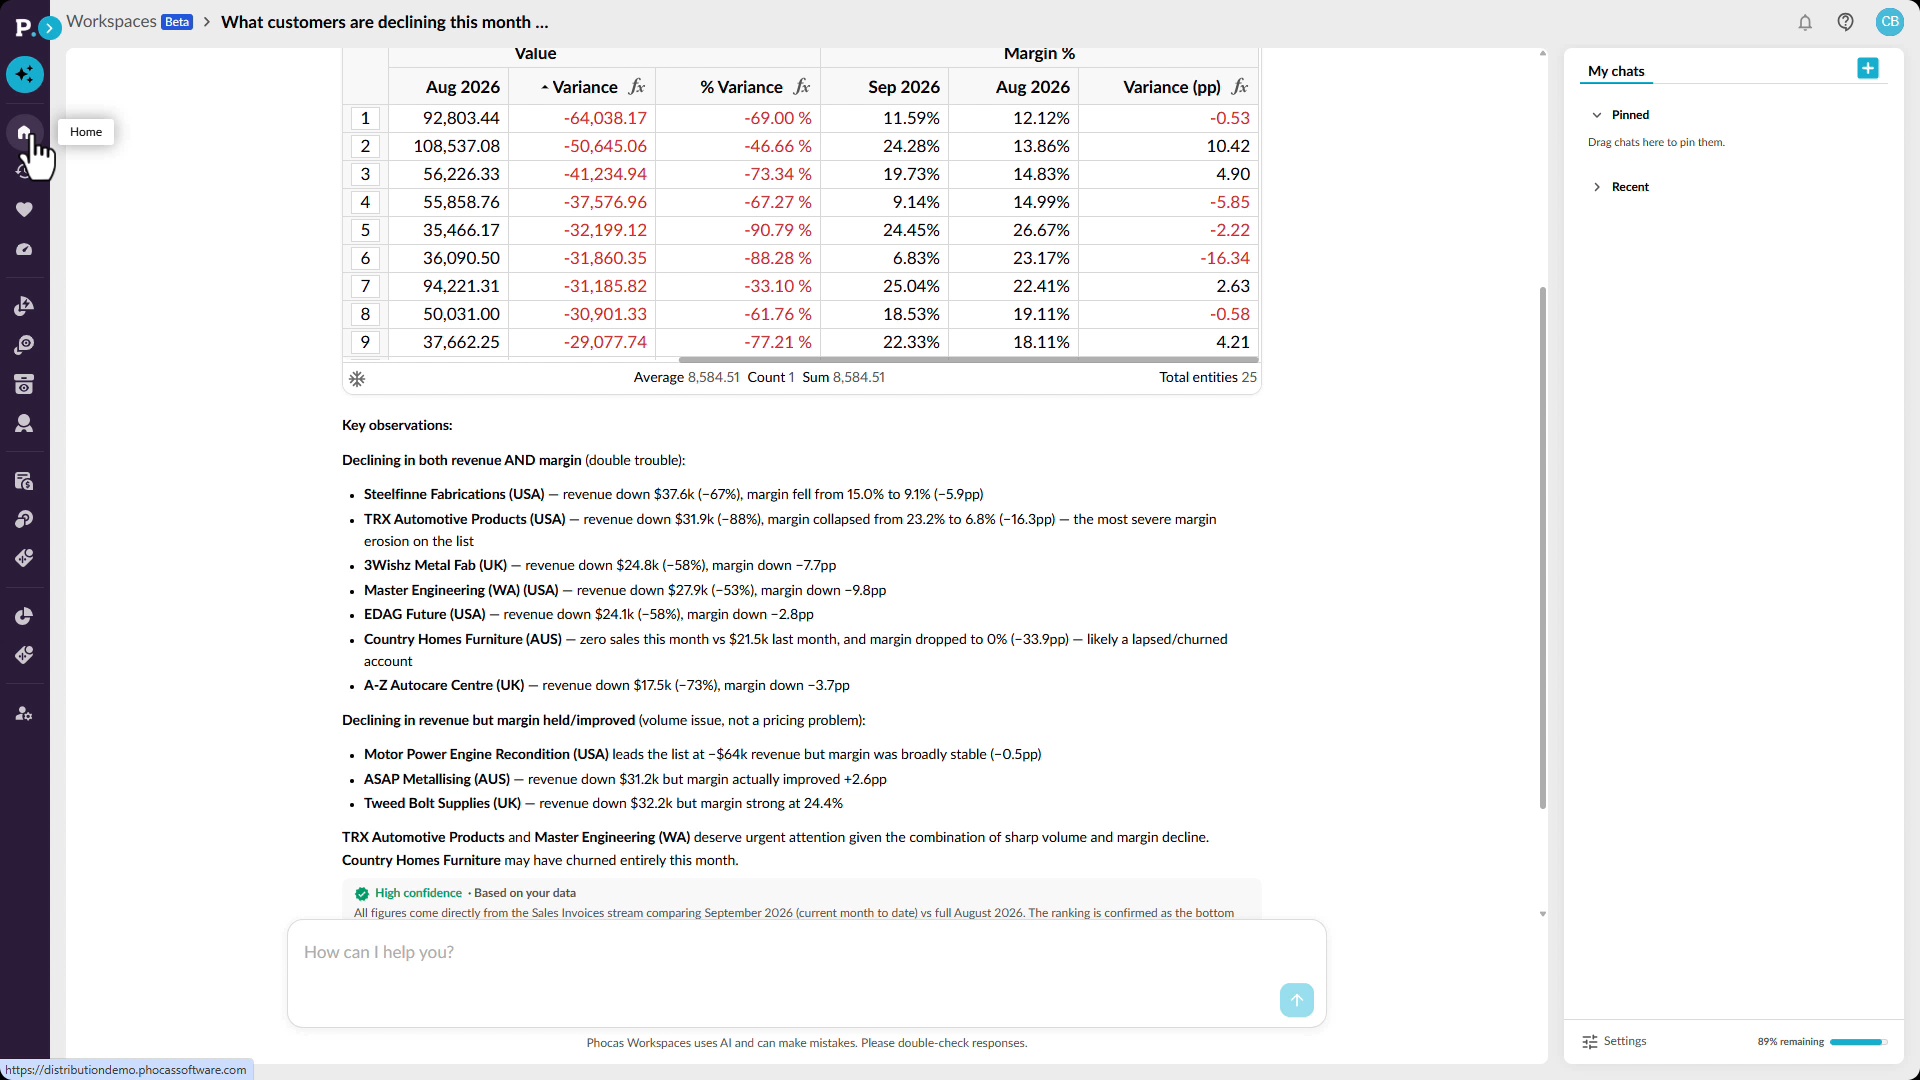
See churn risk across your whole patch
Learn how to see which customers are slipping and who to call first. Ask Workspaces which customers are declining in sales and margin this month, then compare month over month in Analytics to surface customers whose sales fell across three consecutive months. You can make the report dynamic so it updates as new sales come in, and share it with your reps.
 Budgets & Forecasts
Set up comparison rows
Learn how to configure comparison rows that appear beneath each budget row, starting from the default of last year's actuals. You'll change the stream, measure, and offset, add more comparison rows, apply custom formatting, and see how contributors can show or hide them while variance percentages update as they edit.
 Budgets & Forecasts
Use comparison rows
Learn how to show comparison rows that display values from another stream, such as last year's actuals, along with the percentage difference as you adjust your budget. You'll also learn several ways to show or hide them, and, if you have access to financial data, how to view the transactions behind a cell's value from the cell menu.
 Analytics (Classic)
Generate a budget based on previous sales (custom mode)
Learn how to use Custom mode to turn sales from the past two years into next year's budget. You'll add a calculation column that averages the current and previous periods, applies a percentage increase, and then view the resulting budget by product type for a selected sales rep.
