Change your data format
1:47 min
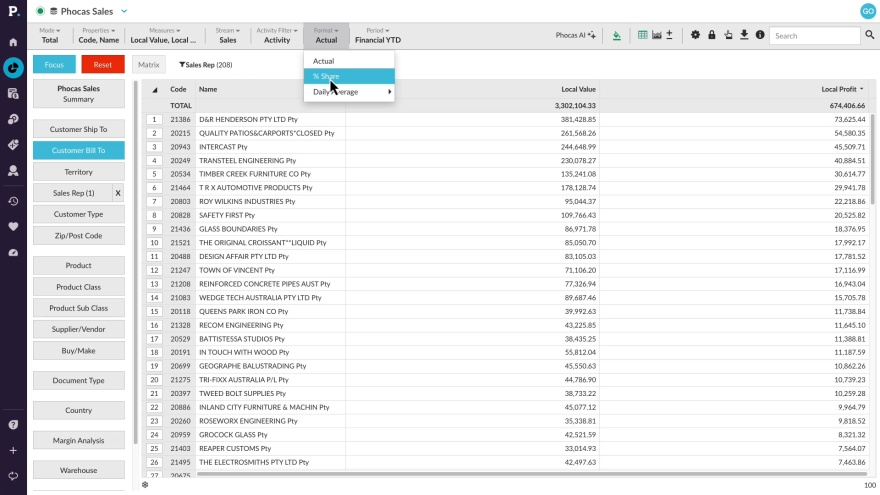
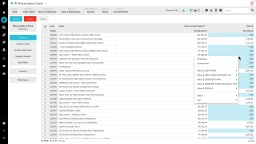
Learn how switching from actual figures to percentage share view can instantly reveal discrepencies between sales value and profitabilty.
Supporting documentation
Phocas product  Analytics
Category
 Help & support
 Related video tutorials
More options for viewing data
Looking for a different perspective? In this video, discover options like "Show Others," "Show Average," "Hide Total," "Totals as Average," and "Show Net Zero." These one-touch features make it easy to explore your data in new ways and satisfy your curiosity.
2:20 min
Add levels to the grid (nesting)
Learn how to bring together related data from different dimensions as an expandable report in the Phocas grid using the 'nest' feature. Grid nesting allows you to display up to three levels of detail, grouped by dimension.
1:59 min
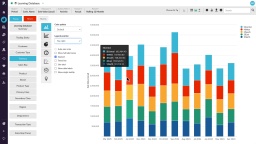
Configure your chart options
See how to change an axis starting point (using auto-axis scale), stack the chart values on top of each other rather than side by side or select and focus on a segment.
3:27 min
Combine inventory and sales to find dead stock
This video takes you into an inventory database. Learn how to combine inventory and sales values to quickly establish what dead stock is on the shelves.
1:46 min