To forecast stock on hand, an inventory manager needs to determine average quantities sold over key time periods, and then assign guidelines to these numbers like trends and current demand. All of these parameters are easy to obtain using sales history in inventory management software.The ability to deliver orders in full and on time (DIFOT) is essential to keeping satisfied customers. And maintaining appropriate stock levels ensures there is enough inventory on hand without tying up capital in unnecessary overstock.
Here we demonstrate in Phocas inventory management software how to build a stock report that will quickly show you how many months of stock you have left for a given product. We do this by adding a column containing a couple of simple calculations.
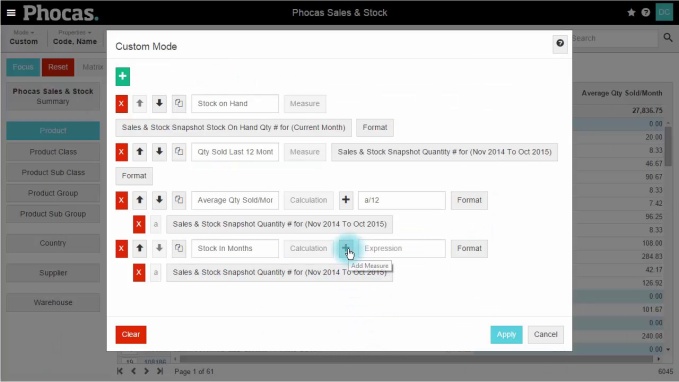
In the Phocas custom mode, we can create a calculation for stock in months. In this calculation, the first measurement (a) represents the total quantity sold over the last 12 months. The second measurement (b) represents the quantity of stock on hand for the current month. Using these measurements, we create an expression as the amount of stock on hand divided by the total quantity sold over the last 12 months (b/(a/12).
In our example of an electrical distributor, we compare the average quantity sold of product ‘large whitete D brass light stands’ over the past 12 months against how much stock we currently have on hand. Now we can quickly see we have enough stock on hand to last the next 222 months. The ability to accurately forecast stock on hand makes creating a lean warehouse much easier. This ensures your investment isn’t wasted on stock that doesn’t sell.
To find out more about using Phocas inventory management software , download this eBook, How to avoid the costs associated with over or understocking


Empowering businesses with intuitive data analytics, driving informed decisions for growth and profitability. We make people feel good about data.
Related blog posts


Browse by category

Find out how our platform gives you the visibility you need to get more done.
Get your demo today