
Last week sales
2026-11-02 – 2026-11-082M
Up 5.15%
Value | 03/11/2025 - 09/11/2025
2M

Confident decisions. Delivered.
"This is exactly what we hoped to see from the next version of Phocas - this puts powerful AI right where our data is."
Beta Customer

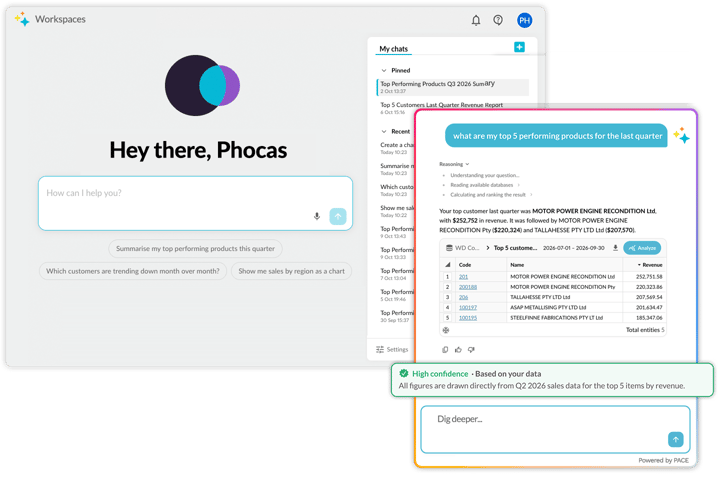
In beta as part of the New Analytics Experience, Workspaces puts PACE - Phocas's new Agentic and Conversational AI Engine – right where your data lives. Anyone can explore, ask, and arrive at strategic insight grounded in the data governance you trust. Choose a question and see how a conversation can turn data into your next step.
Ask a question. Uncover an insight. See where it takes you.
Click a question below to start exploring:
You asked:
I can act as your business analytics assistant in Phocas. I can:
You're a Sales Manager using Phocas for commercial analysis. You prefer direct, data-driven explanations that identify the biggest risks and opportunities and lead to practical actions.
You typically focus on rolling 12-month performance, profitability, customer trends and opportunities to improve commercial results.
I'm already working within Phocas and can investigate the databases and business measures you have permission to access. I understand your working context, but I don't assume I know the actual figures or database structures until I examine them.
When you ask a business question, I evaluate the available databases, identify the relevant data and measures, and bring the information together to deliver insights you can explore further.
Visit Prep · Rolling 12 Months Performance Review
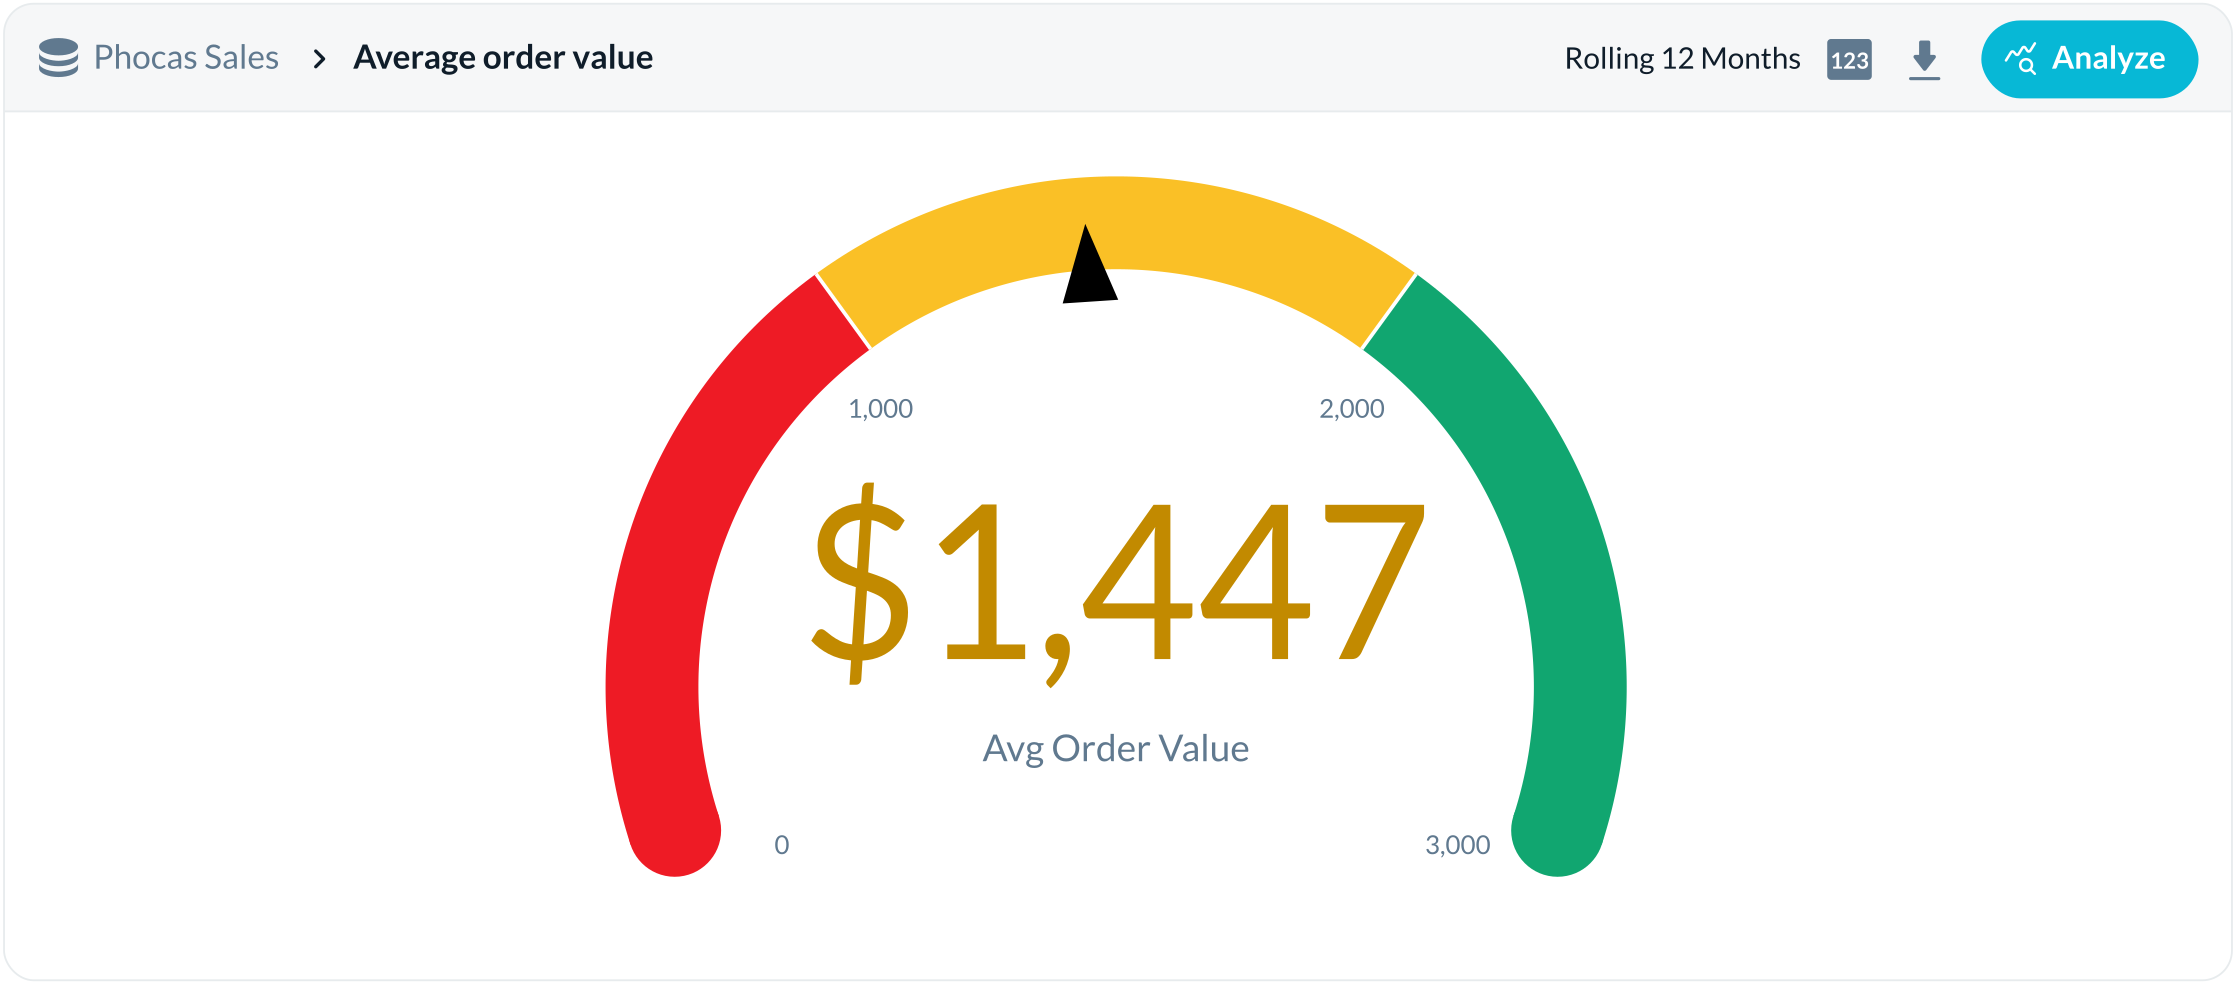
Steelfinne Fabrications has delivered $710k in revenue over the rolling 12 months across 491 orders and 1,412 lines, with an overall margin of 23.8% and profit of $169k. Average order value sits at $1,447.
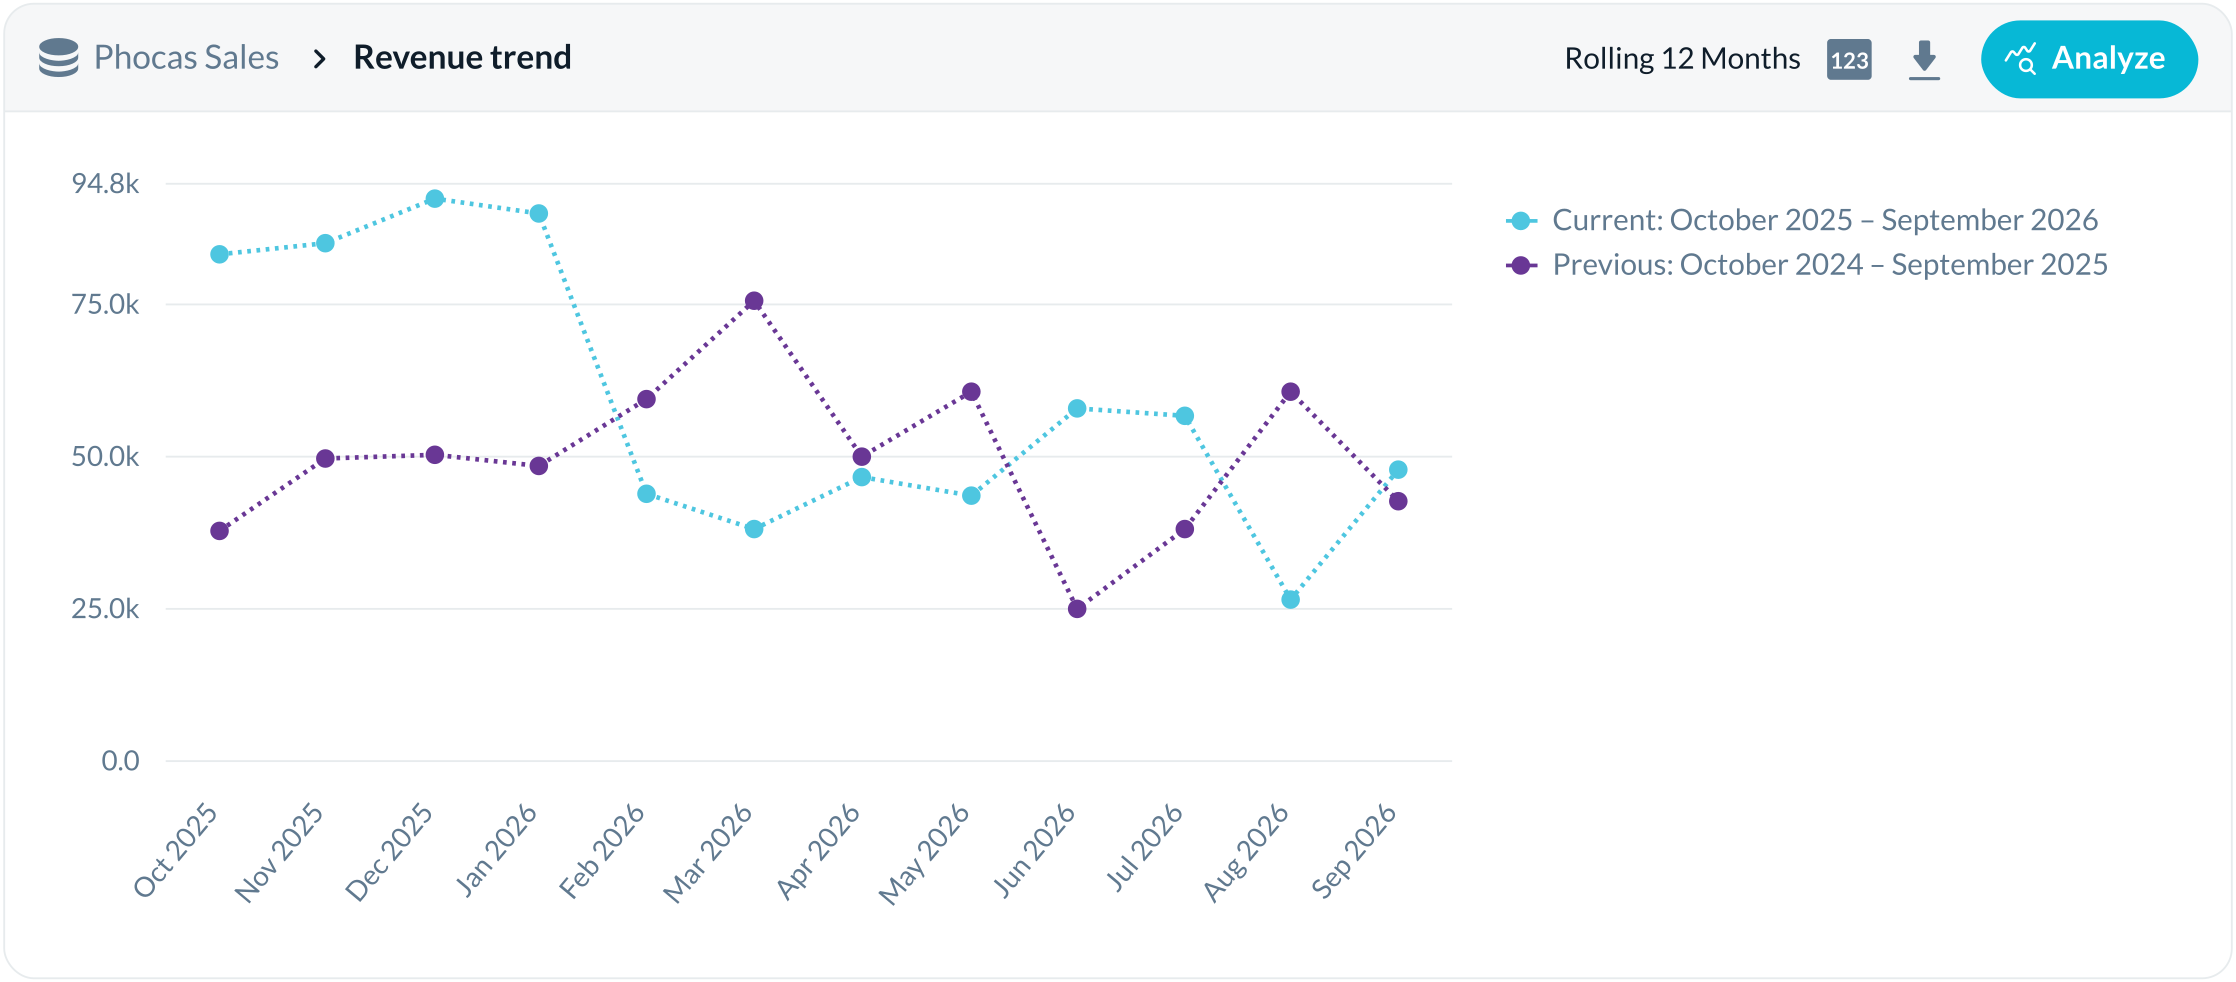
Leading revenue lines are solid – Bezel Trim with Clear Glass tops the list at $12.2k with a healthy 33.7% margin. However, flag two critical conversations:
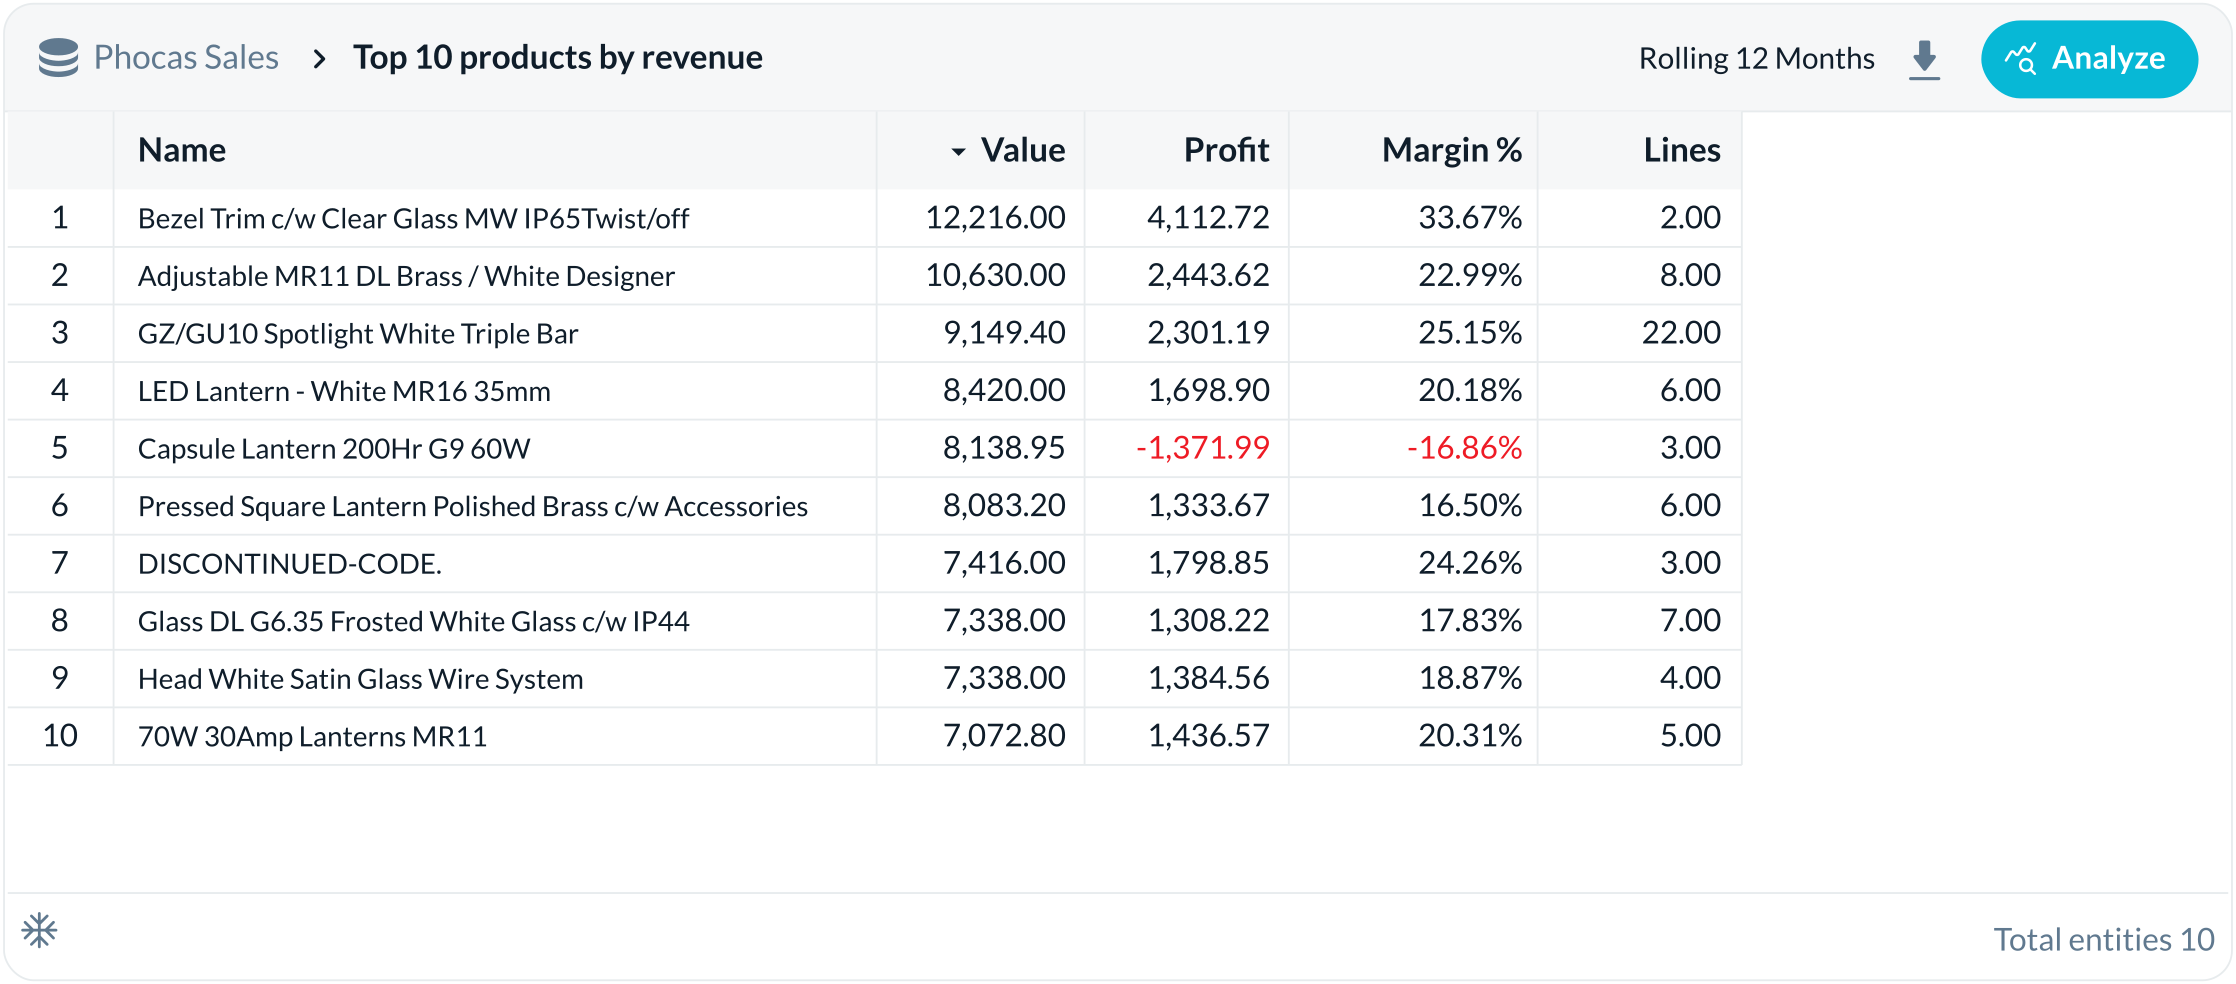
| Name | Value | Profit | Margin % | Lines |
|---|---|---|---|---|
| Bezel Trim c/w Clear Glass MW IP65Twist/off | 12,216.00 | 4,112.72 | 33.67% | 2.00 |
| Adjustable MR11 DL Brass / White Designer | 10,630.00 | 2,443.62 | 22.99% | 8.00 |
| GZ/GU10 Spotlight White Triple Bar | 9,149.40 | 2,301.19 | 25.15% | 22.00 |
| LED Lantern - White MR16 35mm | 8,420.00 | 1,698.90 | 20.18% | 6.00 |
| Capsule Lantern 200Hr G9 60W | 8,138.95 | −1,371.99 | −16.86% | 3.00 |
| Pressed Square Lantern Polished Brass c/w Accessories | 8,083.20 | 1,333.67 | 16.50% | 6.00 |
| DISCONTINUED-CODE. | 7,416.00 | 1,798.85 | 24.26% | 3.00 |
| Glass DL G6.35 Frosted White Glass c/w IP44 | 7,338.00 | 1,308.22 | 17.83% | 7.00 |
| Head White Satin Glass Wire System | 7,338.00 | 1,384.56 | 18.87% | 4.00 |
| 70W 30Amp Lanterns MR11 | 7,072.80 | 1,436.57 | 20.31% | 5.00 |
At $1,447 per order, Steelfinne is comfortably in the mid-range. The gauge below benchmarks this against a $0–$3,000 scale – there is a clear opportunity to grow basket size toward the $2,000+ green zone through bundling, cross-sell into Controls and Outside Lights, or volume incentives.
Use this column chart to walk the customer through the story by category:
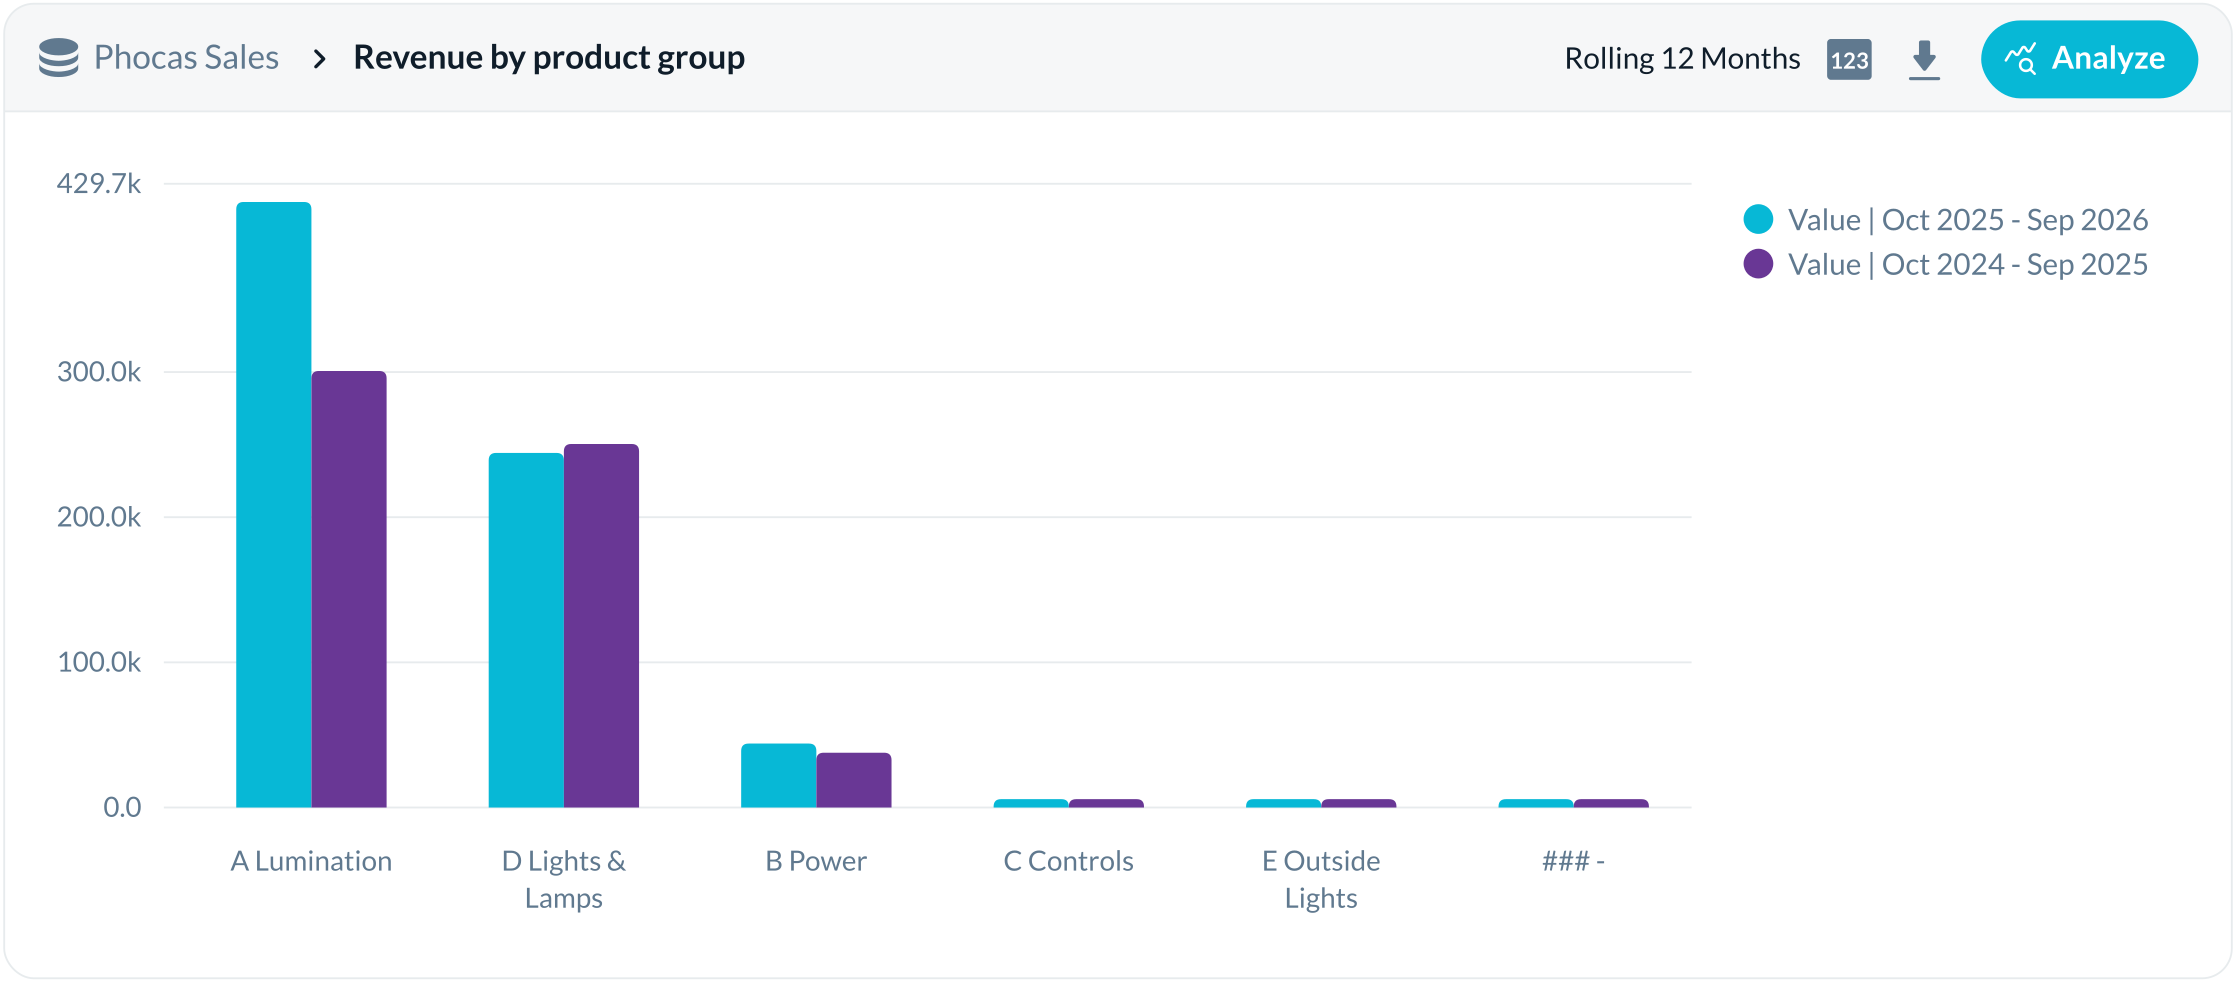
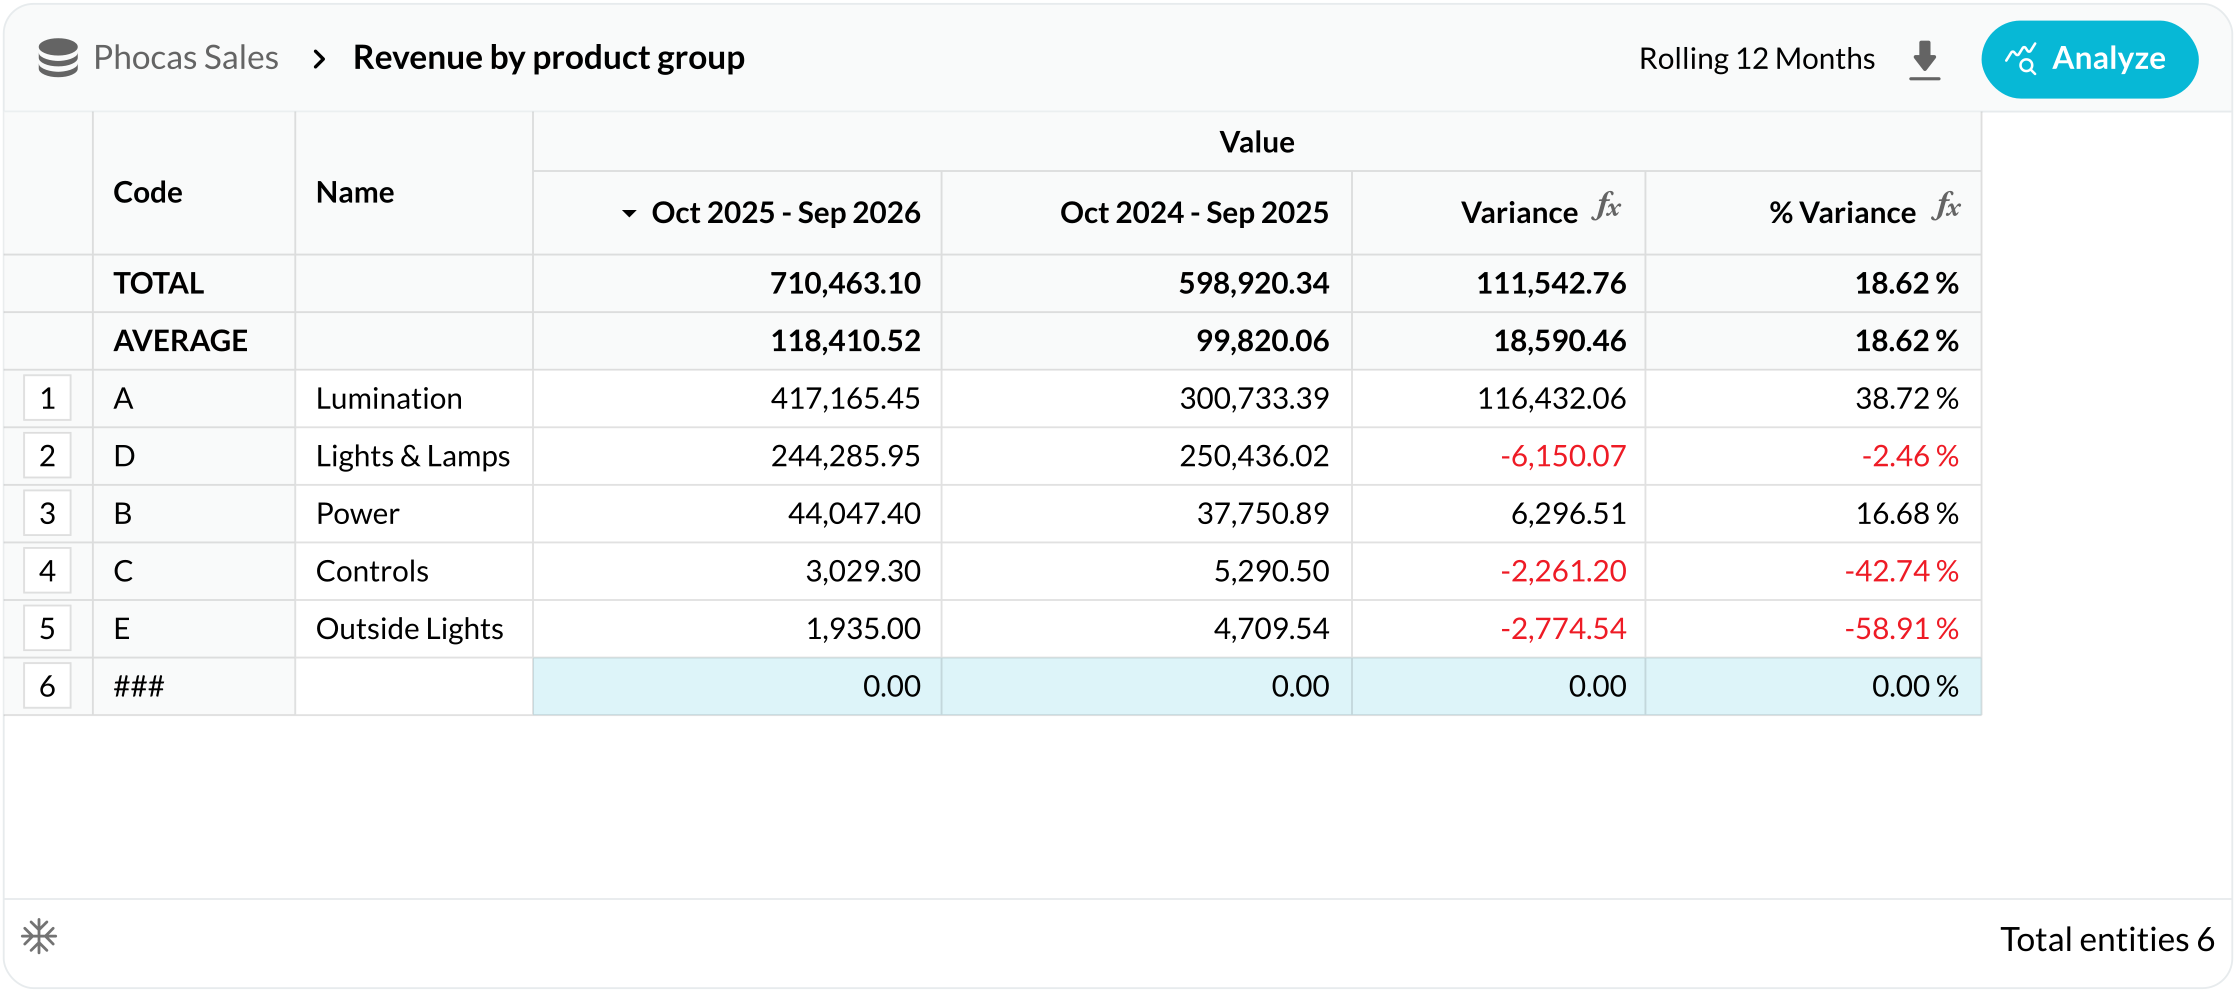
| Product group | Oct 2025–Sep 2026 | Oct 2024–Sep 2025 | % Variance |
|---|---|---|---|
| TOTAL | 710,463.10 | 598,920.34 | 18.62% |
| Lumination | 417165.45 | 300733.39 | +38.72% |
| Lights & Lamps | 244285.95 | 250436.02 | −2.46% |
| Power | 44047.4 | 37750.89 | +16.68% |
| Controls | 3029.3 | 5290.5 | −42.74% |
| Outside Lights | 1935.0 | 4709.54 | −58.91% |
| ### | 0.00 | 0.00 | 0.00% |
Invest behind Lumination—but make margin protection the condition of growth. It is the only large product class combining material scale with strong growth: revenue rose 22.4% to $41.75m and gross profit increased to $9.50m, but margin fell 2.1 percentage points to 22.8%. This is the biggest value opportunity and the largest profit-at-risk if pricing or cost discipline slips.
| Product class | Recommendation | Action |
|---|---|---|
| Lumination | Invest | Fund availability and customer growth, while enforcing margin recovery through repricing, mix management and supplier-cost review. |
| Lights & Lamps | Improve | Protect the strong margin base and invest selectively in the highest-turning customer and SKU opportunities. |
| Power | Improve | Halt broad expansion; focus on recovering lost revenue and margin before increasing inventory. |
| Outside Lights | Reconsider | Reduce slow-moving range and inventory exposure; retain only differentiated, profitable demand. |
| Controls | Reconsider | Run a focused SKU/customer review and exit or reprice segments that cannot restore profitable volume. |
Assumptions and limitation: stock turnover is calculated as rolling-12-month revenue divided by current stock-on-hand value. The available data does not expose a separate formal turnover measure or average-inventory balance, so this is a directional working-capital proxy. The analysis was informed by Phocas Sales, Purchasing and Stock only; no additional database was required.
The chart shows how product classes compare on revenue growth and gross margin, with bubble size representing sales. It reveals where strong growth and healthy margins align — and where the biggest categories may warrant a closer look.
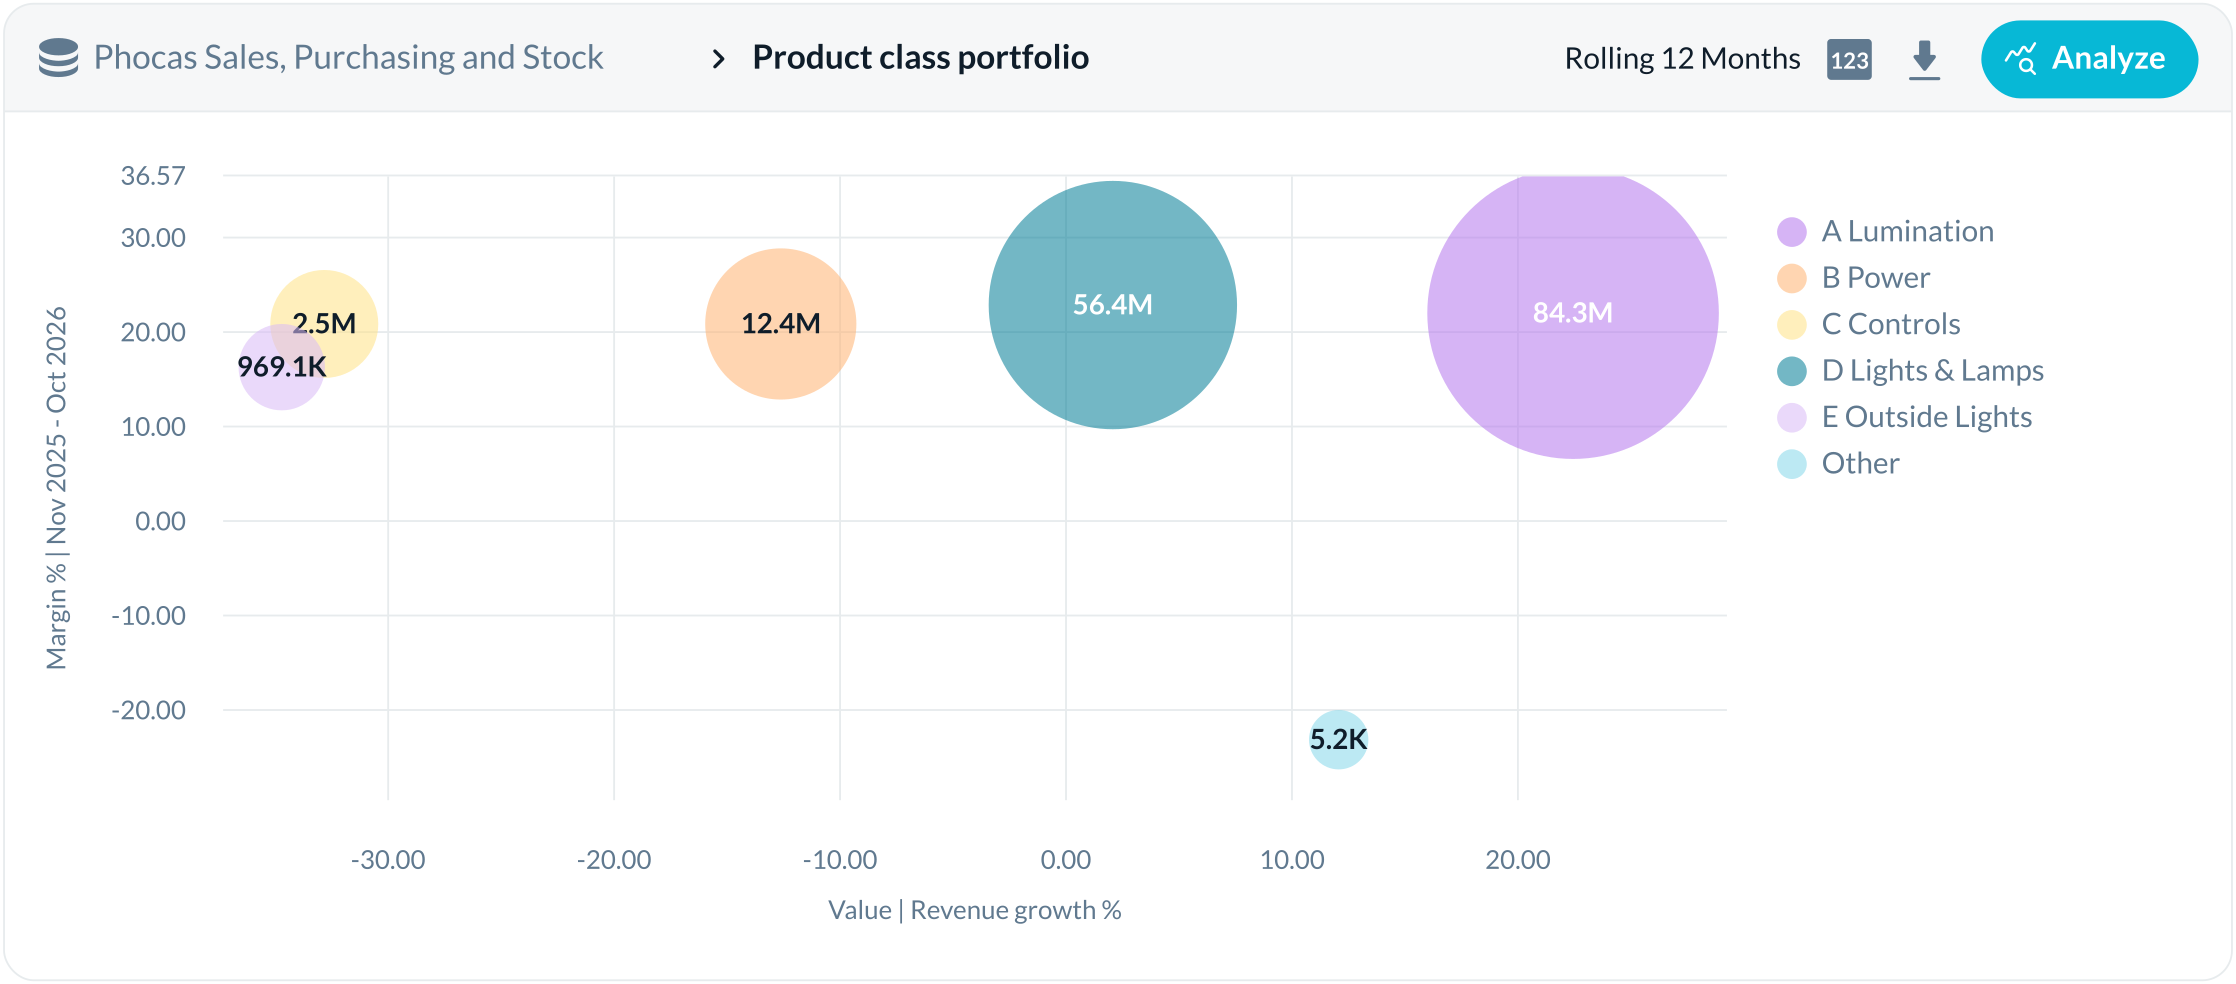
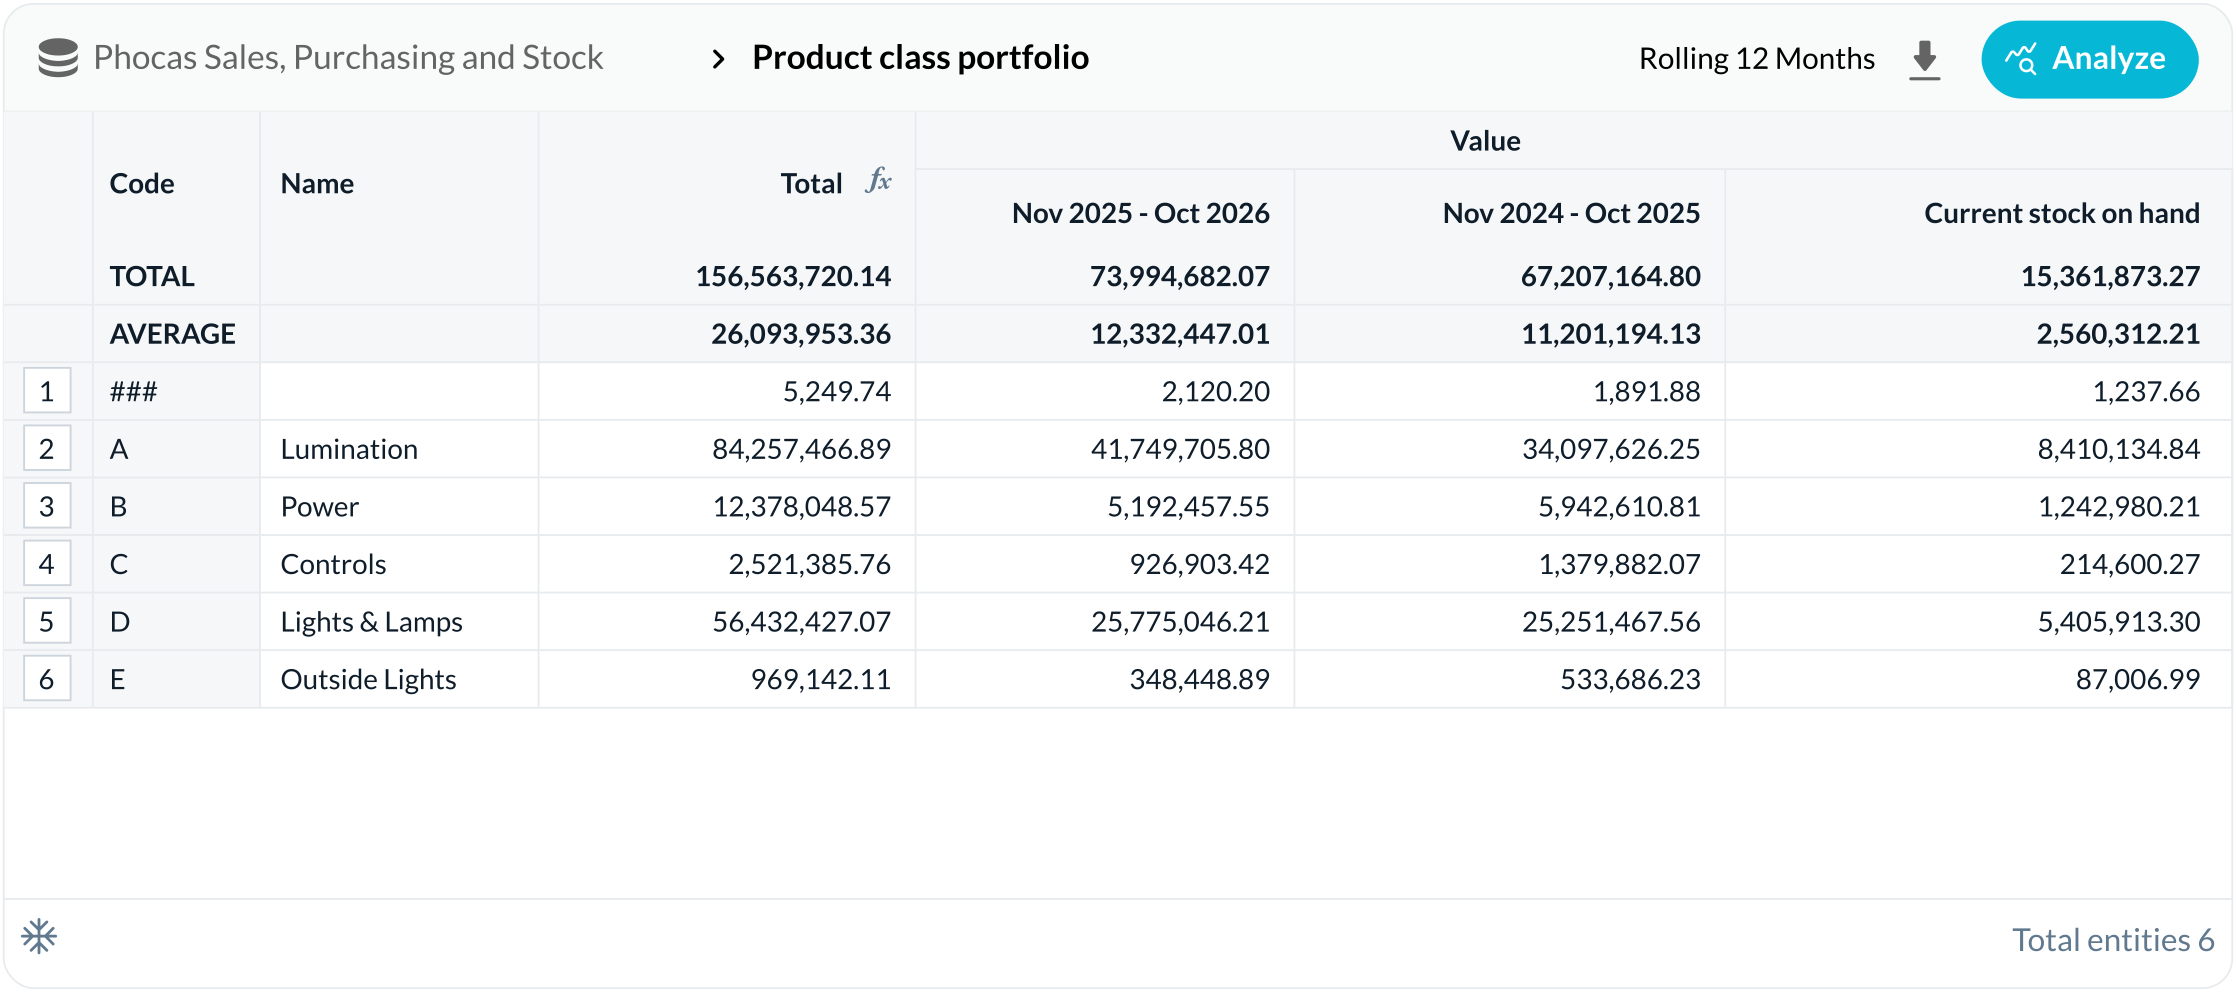
| Product class | Total | Nov 2025–Oct 2026 revenue | Nov 2024–Oct 2025 revenue | Current stock on hand |
|---|---|---|---|---|
| Unidentified (###) | 5,249.74 | 2,120.20 | 1,891.88 | 1,237.66 |
| Lumination | 84,257,466.89 | 41,749,705.80 | 34,097,626.25 | 8,410,134.84 |
| Power | 12,378,048.57 | 5,192,457.55 | 5,942,610.81 | 1,242,980.21 |
| Controls | 2,521,385.76 | 926,903.42 | 1,379,882.07 | 214,600.27 |
| Lights & Lamps | 56,432,427.07 | 25,775,046.21 | 25,251,467.56 | 5,405,913.30 |
| Outside Lights | 969,142.11 | 348,448.89 | 533,686.23 | 87,006.99 |
Customer concentration in the highest-impact class: The top five Lumination customers contribute approximately $4.99m, or 12.0% of the class’s current rolling-12-month revenue. Concentration is meaningful but not excessive; the larger strategic risk is margin compression across the broader class rather than dependence on one account.
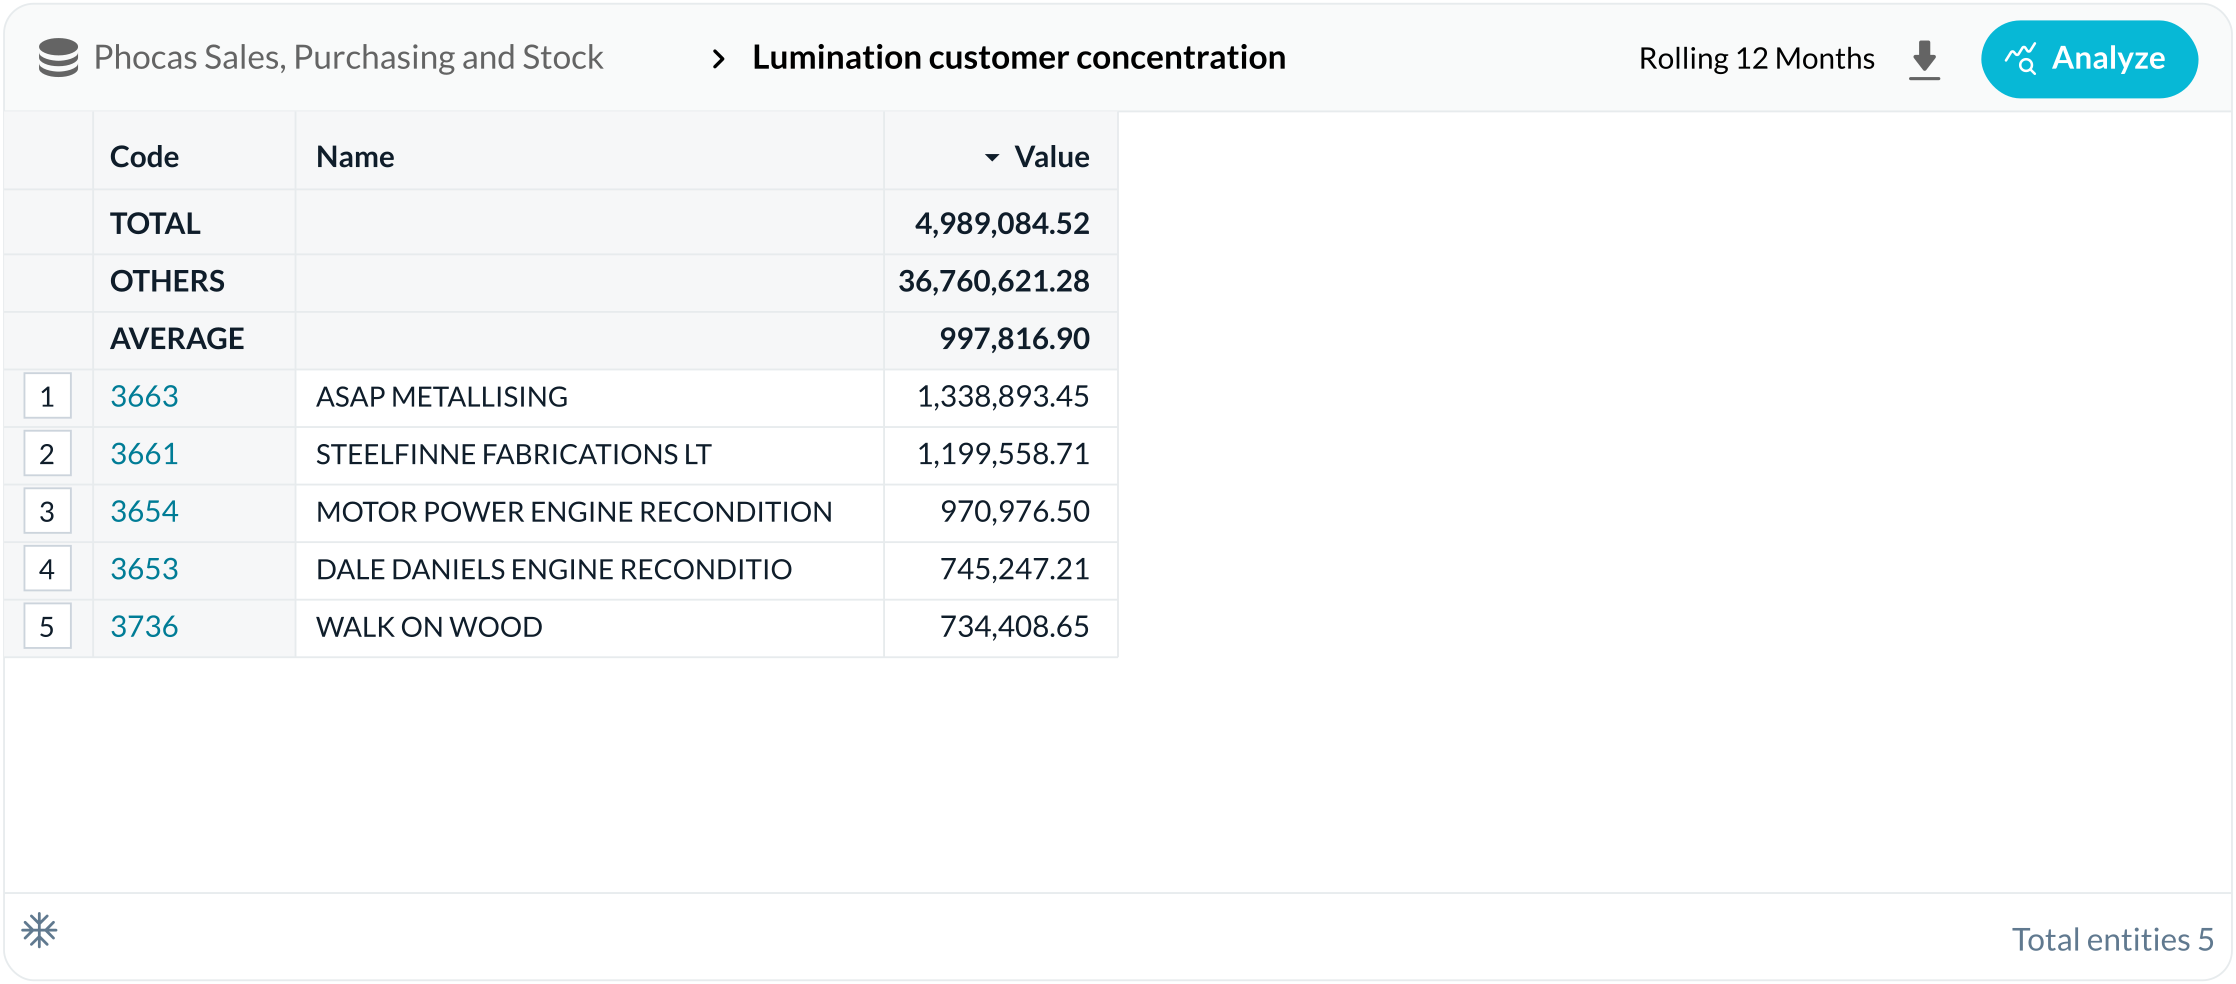
| Customer | Code | Revenue |
|---|---|---|
| ASAP METALLISING | 3663 | 1,338,893.45 |
| STEELFINNE FABRICATIONS LT | 3661 | 1,199,558.71 |
| MOTOR POWER ENGINE RECONDITION | 3654 | 970,976.50 |
| DALE DANIELS ENGINE RECONDITIO | 3653 | 745,247.21 |
| WALK ON WOOD | 3736 | 734,408.65 |
| TOTAL | 4,989,084.52 | |
| OTHERS | 36,760,621.28 | |
| AVERAGE | 997,816.90 |
The strongest candidates to move to a cheaper warehouse are high-quantity items with very low or negative sales GMROI. I ranked the full 96-product active stock set by lowest GMROI, restricted to the top-100 quantity cohort.
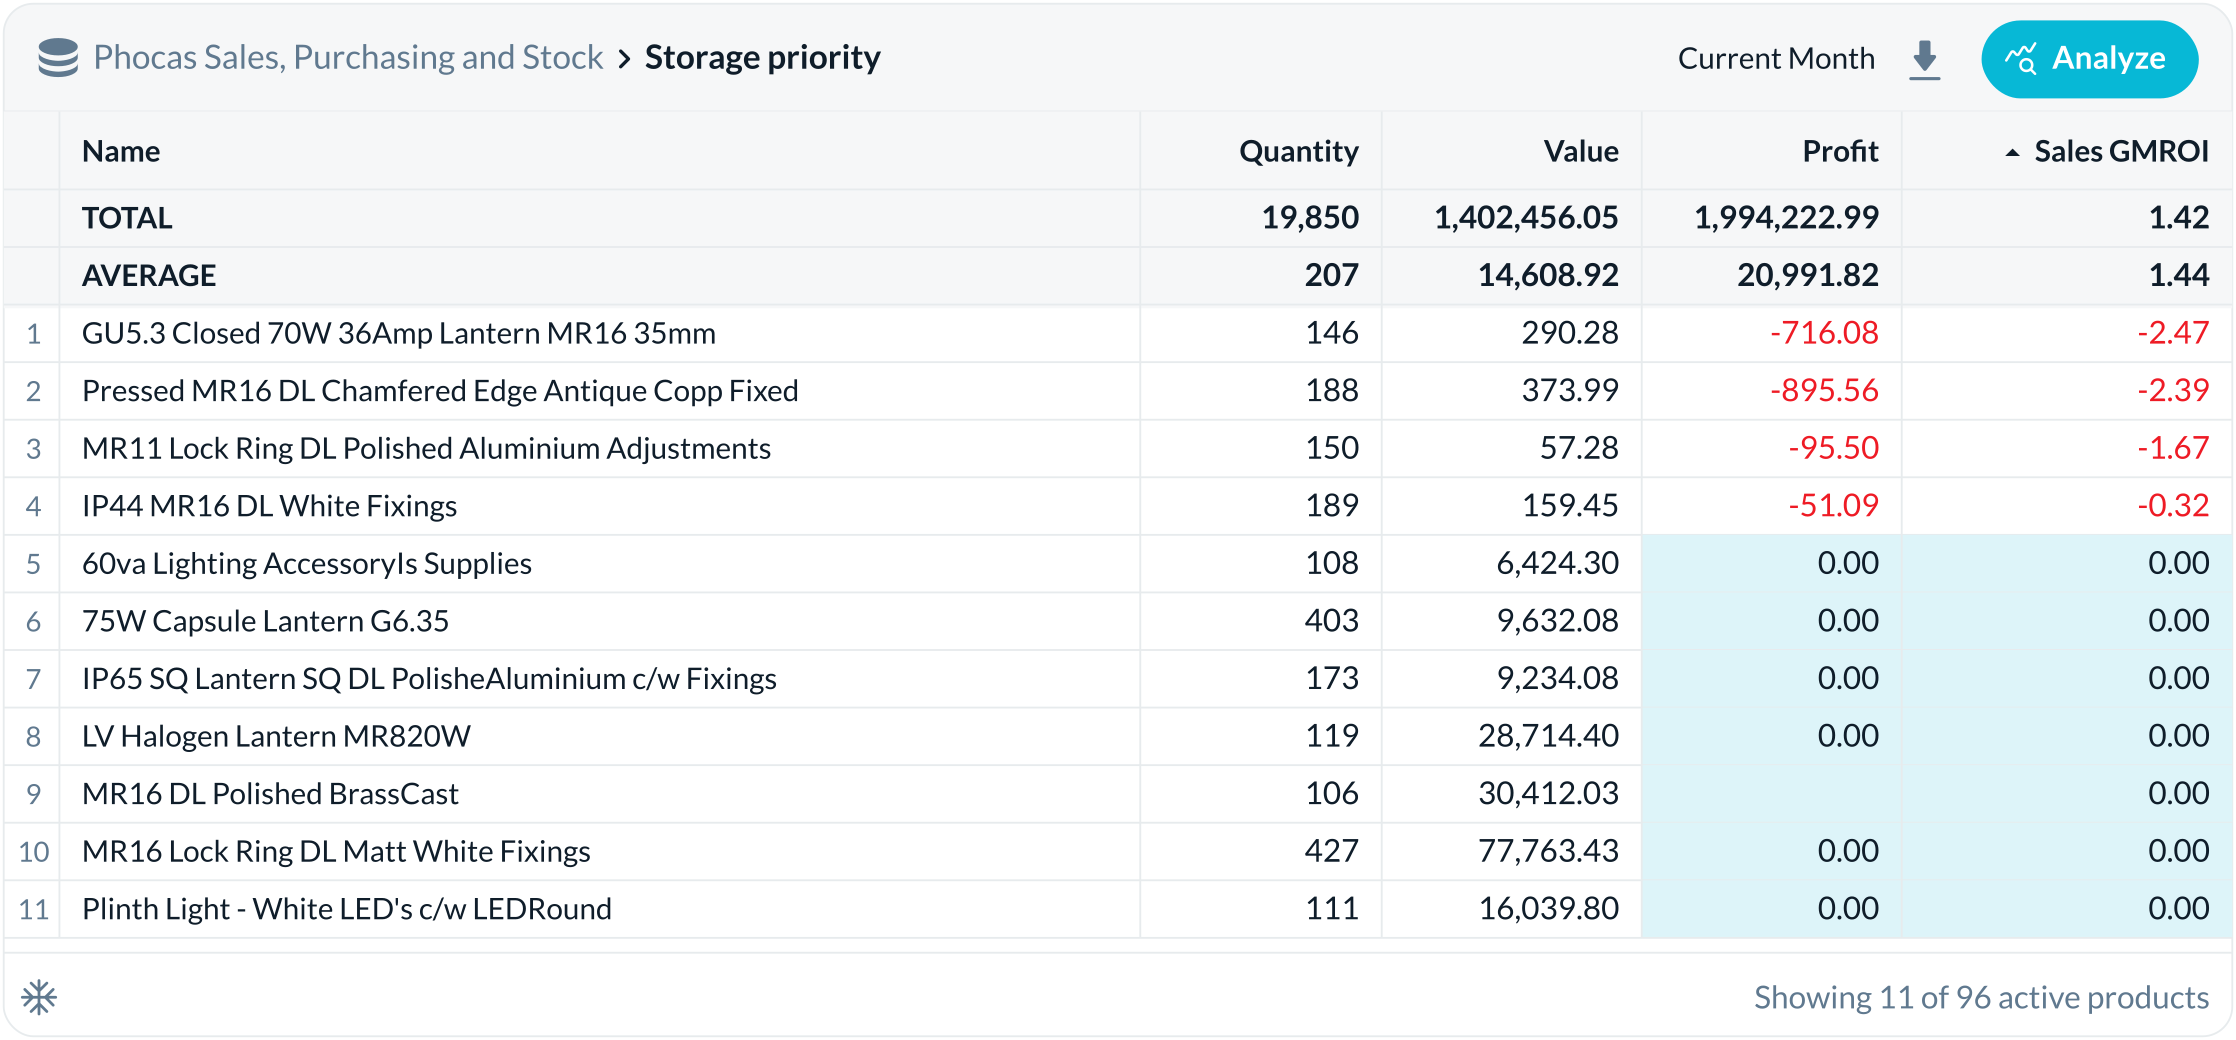
| Name | Quantity | Value | Profit | Sales GMROI |
|---|---|---|---|---|
| TOTAL | 19,850 | 1,402,456.05 | 1,994,222.99 | 1.42 |
| AVERAGE | 207 | 14,608.92 | 20,991.82 | 1.44 |
| GU5.3 Closed 70W 36Amp Lantern MR16 35mm | 146 | 290.28 | -716.08 | -2.47 |
| Pressed MR16 DL Chamfered Edge Antique Copp Fixed | 188 | 373.99 | -895.56 | -2.39 |
| MR11 Lock Ring DL Polished Aluminium Adjustments | 150 | 57.28 | -95.50 | -1.67 |
| IP44 MR16 DL White Fixings | 189 | 159.45 | -51.09 | -0.32 |
| 60va Lighting AccessoryIs Supplies | 108 | 6,424.30 | 0.00 | 0.00 |
| 75W Capsule Lantern G6.35 | 403 | 9,632.08 | 0.00 | 0.00 |
| IP65 SQ Lantern SQ DL PolisheAluminium c/w Fixings | 173 | 9,234.08 | 0.00 | 0.00 |
| LV Halogen Lantern MR820W | 119 | 28,714.40 | 0.00 | 0.00 |
| MR16 DL Polished BrassCast | 106 | 30,412.03 | 0.00 | |
| MR16 Lock Ring DL Matt White Fixings | 427 | 77,763.43 | 0.00 | 0.00 |
| Plinth Light - White LED's c/w LEDRound | 111 | 16,039.80 | 0.00 | 0.00 |
Weekly momentum is positive: sales reached $1.65m, up 5.1% year on year. The warning signs are month-to-date sales at $1.95m, down 1.8%, and quarterly gross margin at 19.4%, down 5.7 percentage points.
Up 5.15%
Value | 03/11/2025 - 09/11/2025
2M
Down 1.78%
Value | 01/11/2025 - 09/11/2025
2M
Up -5.7
Margin % | 01/10/2025 - 09/11/2025
25.1%
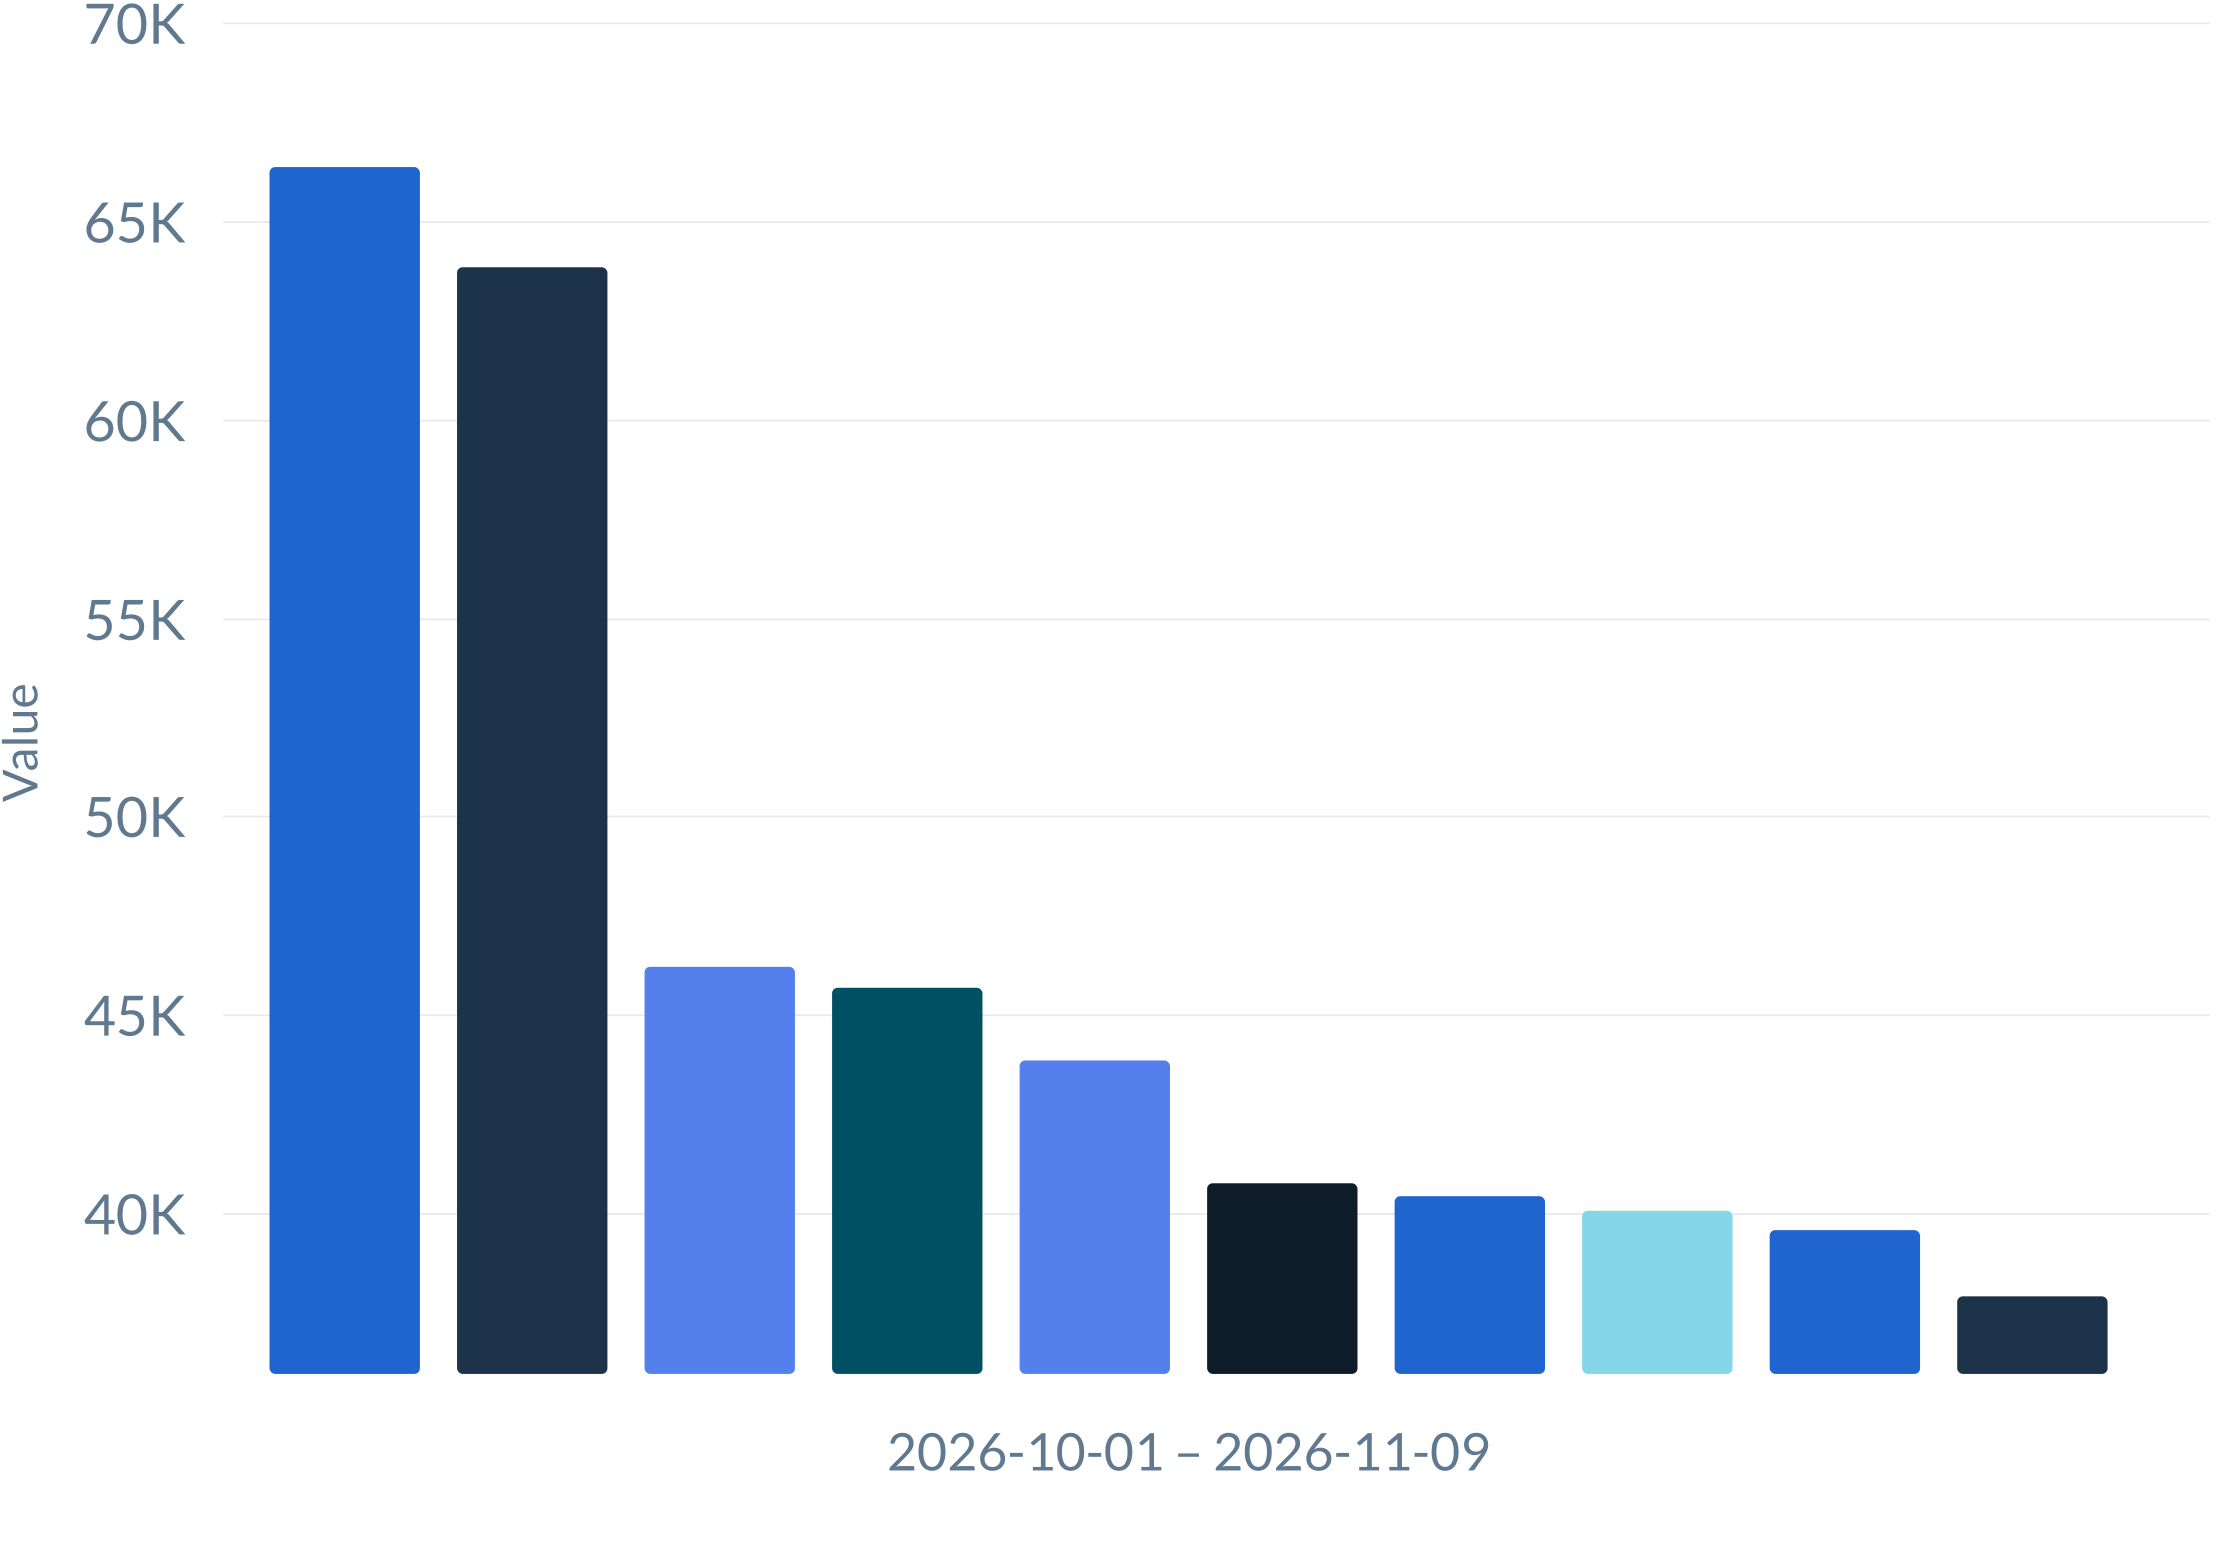
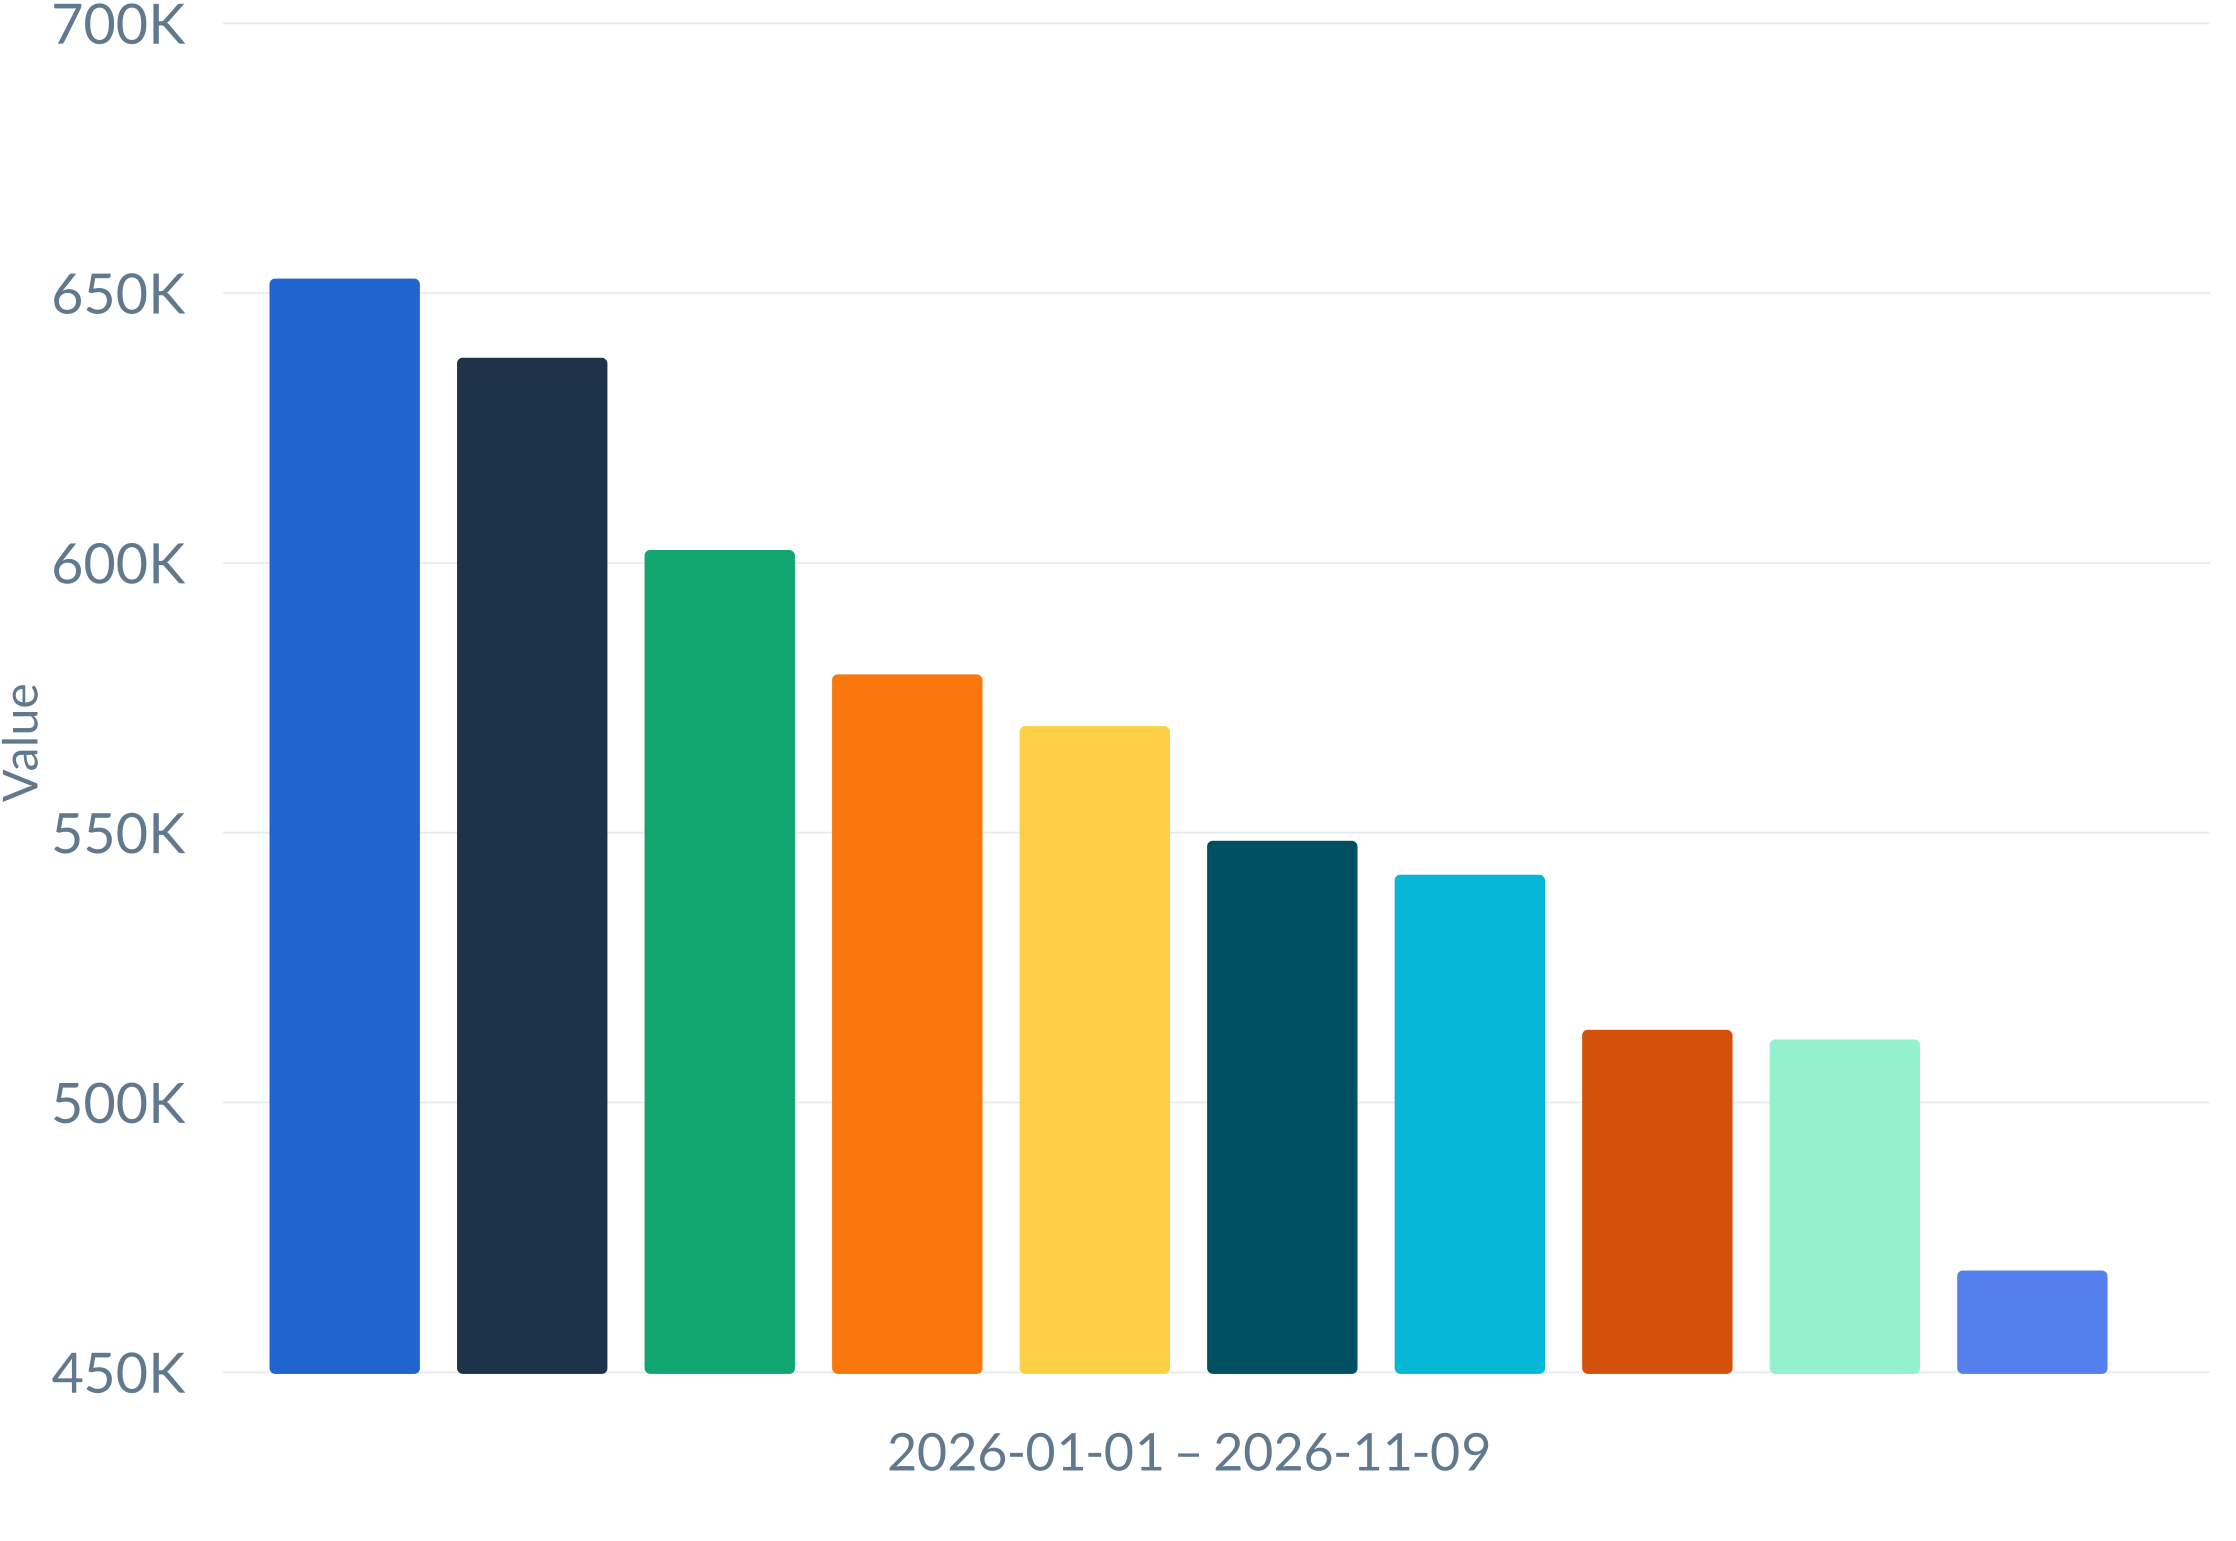
| Code | Name | Value | ||||
|---|---|---|---|---|---|---|
| Jan 2026 - Nov 2026 | Jan 2025 - Nov 2025 | Variance | % Variance | |||
| TOTAL | 1,648,100.88 | 2,856,125.15 | -1,208,024.27 | -42.30% | ||
| AVERAGE | 329,620.18 | 571,225.03 | -241,604.85 | -42.30% | ||
| 1 | 300187 | DALE DANIELS ENGINE RECONDITIO - USA | 329,183.74 | 635,976.24 | -306,792.50 | -48.24% |
| 2 | 200187 | DALE DANIELS ENGINE RECONDITIO - UK | 358,814.69 | 621,854.25 | -263,039.56 | -42.30% |
| 3 | 100187 | DALE DANIELS ENGINE RECONDITIO - AUS | 385,102.75 | 614,703.84 | -229,601.09 | -37.35% |
| 4 | 300188 | MOTOR POWER ENGINE RECONDITION - USA | 468,865.40 | 683,414.71 | -214,549.31 | -31.39% |
| 5 | 100464 | SELECT KITCHENS - AUS | 106,134.30 | 300,176.11 | -194,041.81 | -64.64% |
| Code | Name | Margin % | |||
|---|---|---|---|---|---|
| 01/10/2026 - 09/11/2026 | 01/10/2025 - 09/11/2025 | Variance (pp) | |||
| TOTAL | 19.38% | 25.12% | -5.75 | ||
| AVERAGE | 17.52% | 19.52% | -1.99 | ||
| 1 | E | Outside Lights | 14.03% | 23.70% | -9.67 |
| 2 | A | Lumination | 18.40% | 25.52% | -7.12 |
| 3 | D | Lights & Lamps | 20.82% | 25.13% | -4.31 |
| 4 | B | Power | 19.99% | 23.25% | -3.25 |
| 5 | C | Controls | 22.07% | 19.50% | 2.57 |
| 6 | ### | 9.84% | 0.00% | 9.83 | |
The forward outlook shows $24.7m of sales, $6.0m of profit and a 24.2% margin. That provides a solid earnings base, but the immediate management priority should be protecting margin and converting inventory and receivables into cash. Recent sales have recovered from roughly $4.8m per month to $7.9m, while monthly margin has remained materially below the earlier rolling-year level—recently around 18–19% versus approximately 26% earlier in the period.
The direct cash-flow report shows large gross movements, particularly $117.9m of inventory purchases, $34.9m paid to suppliers, $47.0m paid to employees and $210.0m of customer receipts. The reported categories broadly net to zero, so this view should be treated as a movement bridge rather than a standalone liquidity forecast. The practical cash-flow risk is clear: cash is exposed to the timing gap between purchasing, inventory conversion and collections. A 13-week cash forecast should therefore be monitored weekly, with separate scenarios for slower collections, margin deterioration and delayed stock turns.
The best available proxy for cash-flow pressure is accounts-payable outstanding due in the next quarter, ranked against each supplier’s rolling-12-month outstanding balance. This is an exposure-based view, not a formal cash-flow forecast.
The 10 largest supplier exposures total $345.3k for the next quarter, versus $427.0k across the comparable rolling-12-month measure. The largest risks are WA RUSTIC TOUCH Ltd ($66.6k), NOZTEC Ltd ($68.4k), and HARTWAY GALVANIZERS Ltd ($36.0k); the first two together account for roughly 39% of the ranked exposure. The supplier grid also identifies the associated buyer/company owners for follow-up.
By branch, the ranked exposure totals $1.236m next quarter versus $1.858m on the rolling-12-month measure. The most affected branches are Sydney Central ($202.2k), Los Angeles Downtown ($160.1k), and Brisbane North ($136.5k). Sydney Central alone represents about 16% of the branch exposure, so it is the clearest immediate concentration to review.
These are the most actionable historical indicators of likely cash outflows: prioritise the largest supplier balances within Sydney Central, Los Angeles Downtown and Brisbane North, then validate payment dates, dispute status and any ability to defer settlement.
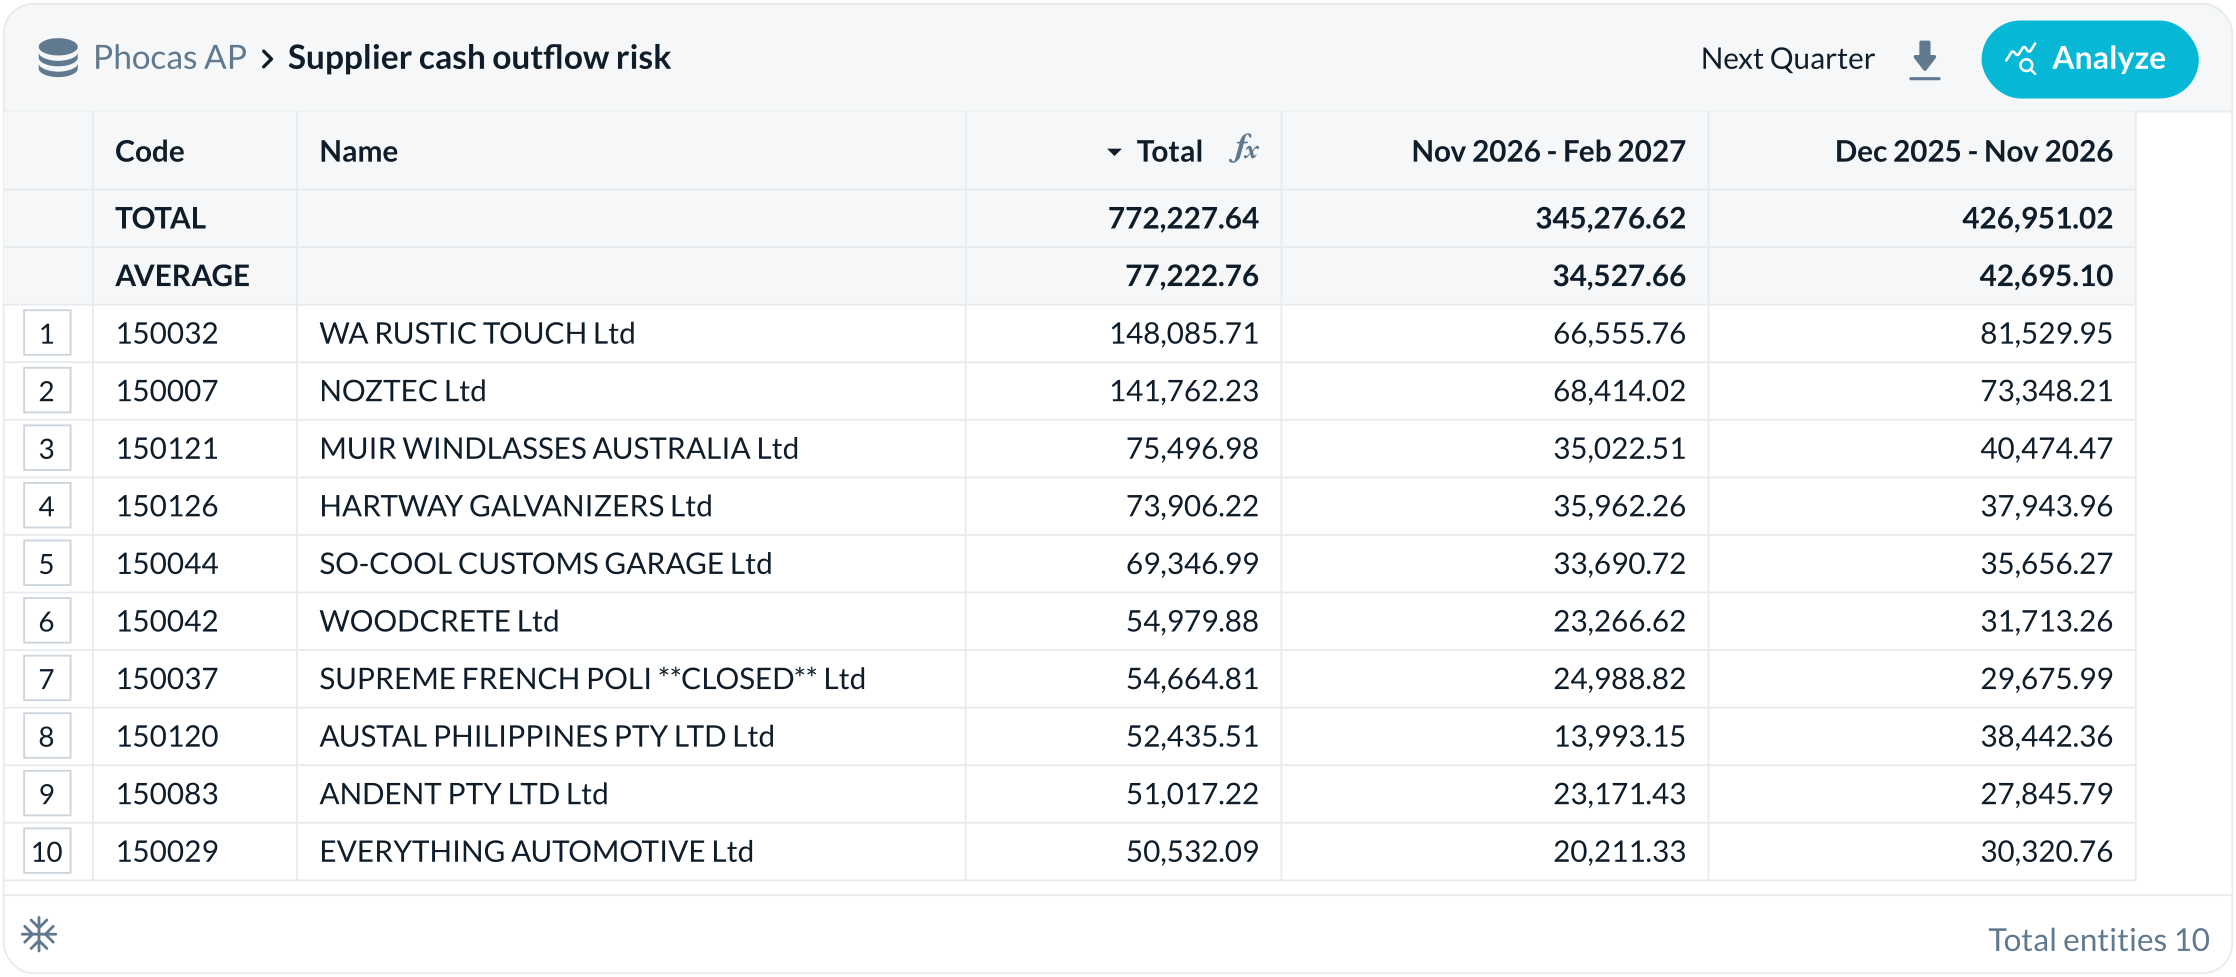
| Code | Name | Total | Nov 2026 - Feb 2027 | Dec 2025 - Nov 2026 |
|---|---|---|---|---|
| TOTAL | 772,227.64 | 345,276.62 | 426,951.02 | |
| AVERAGE | 77,222.76 | 34,527.66 | 42,695.10 | |
| 150032 | WA RUSTIC TOUCH Ltd | 148,085.71 | 66,555.76 | 81,529.95 |
| 150007 | NOZTEC Ltd | 141,762.23 | 68,414.02 | 73,348.21 |
| 150121 | MUIR WINDLASSES AUSTRALIA Ltd | 75,496.98 | 35,022.51 | 40,474.47 |
| 150126 | HARTWAY GALVANIZERS Ltd | 73,906.22 | 35,962.26 | 37,943.96 |
| 150044 | SO-COOL CUSTOMS GARAGE Ltd | 69,346.99 | 33,690.72 | 35,656.27 |
| 150042 | WOODCRETE Ltd | 54,979.88 | 23,266.62 | 31,713.26 |
| 150037 | SUPREME FRENCH POLI **CLOSED** Ltd | 54,664.81 | 24,988.82 | 29,675.99 |
| 150120 | AUSTAL PHILIPPINES PTY LTD Ltd | 52,435.51 | 13,993.15 | 38,442.36 |
| 150083 | ANDENT PTY LTD Ltd | 51,017.22 | 23,171.43 | 27,845.79 |
| 150029 | EVERYTHING AUTOMOTIVE Ltd | 50,532.09 | 20,211.33 | 30,320.76 |
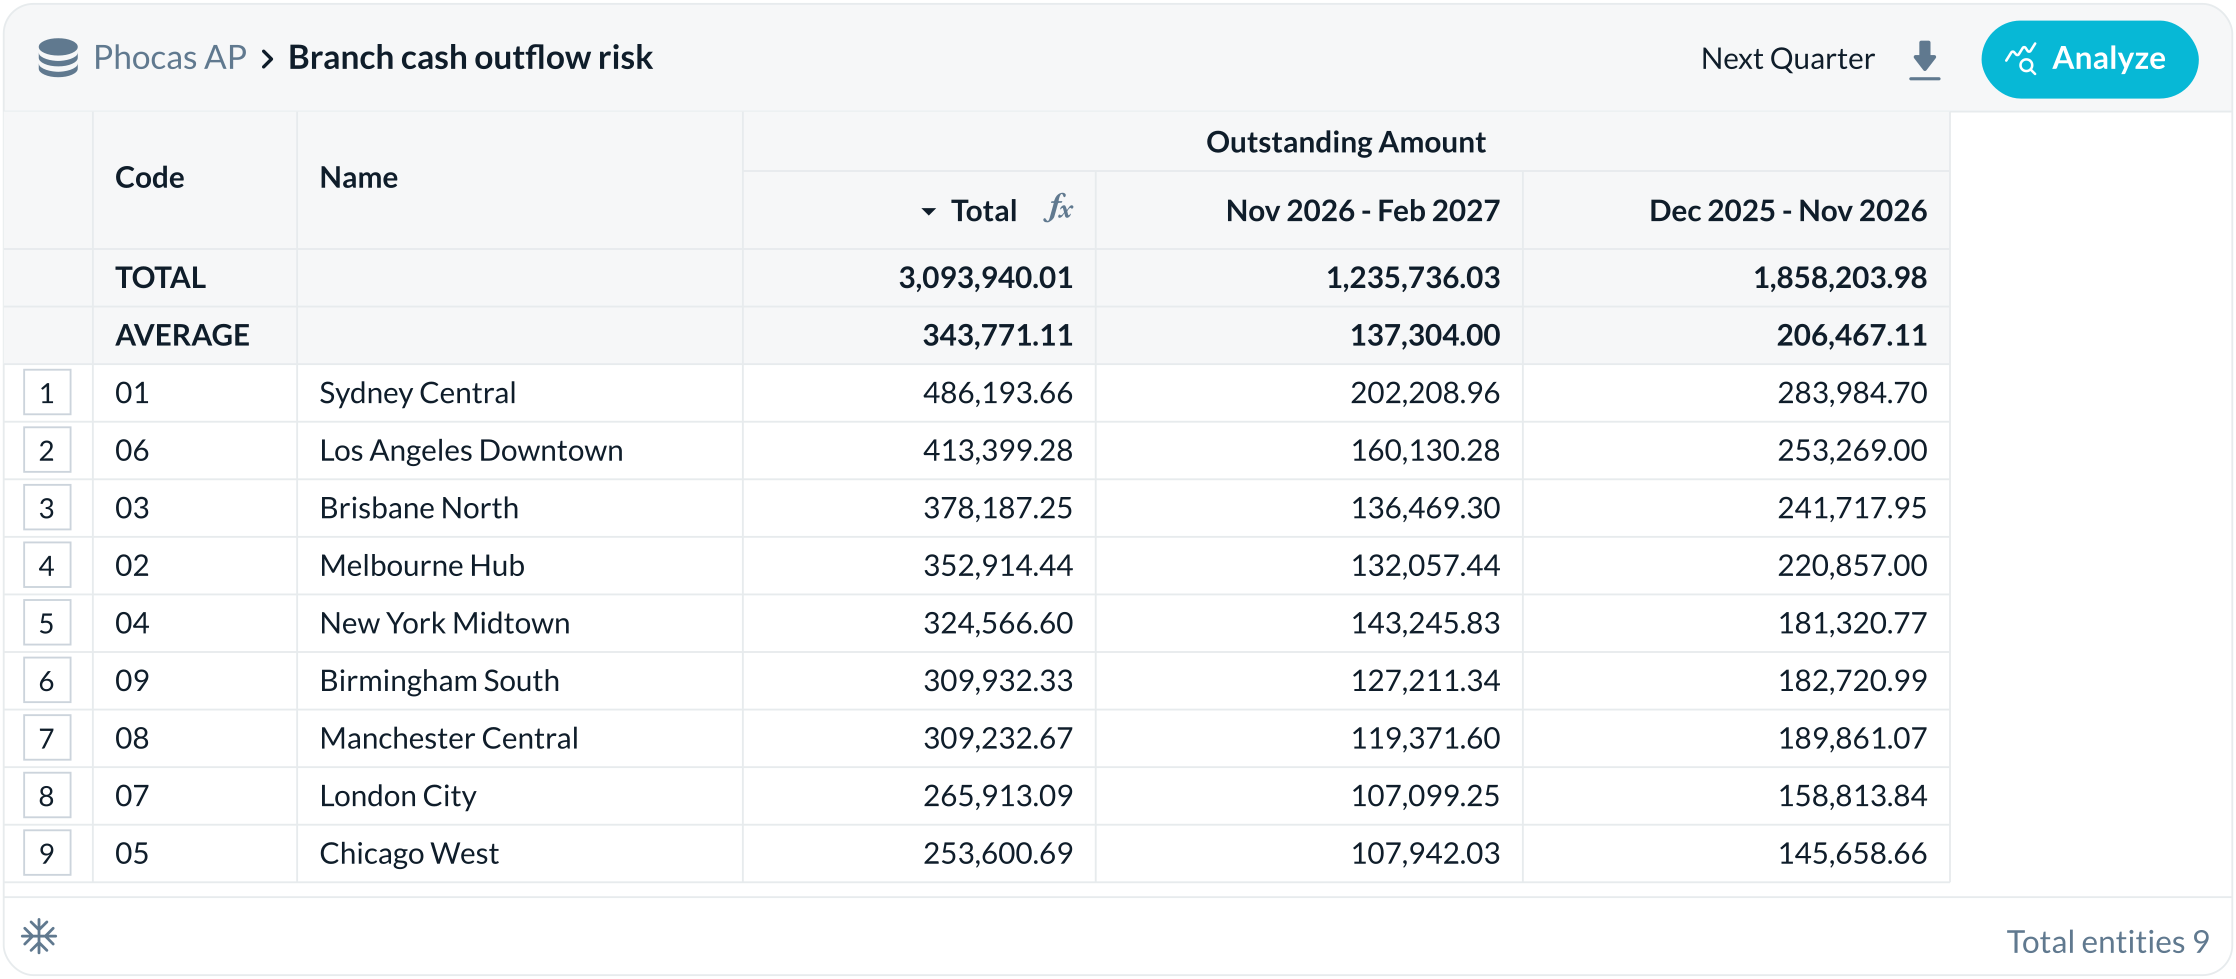
| Code | Name | Total | Nov 2026 - Feb 2027 | Dec 2025 - Nov 2026 |
|---|---|---|---|---|
| TOTAL | 3,093,940.01 | 1,235,736.03 | 1,858,203.98 | |
| AVERAGE | 343,771.11 | 137,304.00 | 206,467.11 | |
| 01 | Sydney Central | 486,193.66 | 202,208.96 | 283,984.70 |
| 06 | Los Angeles Downtown | 413,399.28 | 160,130.28 | 253,269.00 |
| 03 | Brisbane North | 378,187.25 | 136,469.30 | 241,717.95 |
| 02 | Melbourne Hub | 352,914.44 | 132,057.44 | 220,857.00 |
| 04 | New York Midtown | 324,566.60 | 143,245.83 | 181,320.77 |
| 09 | Birmingham South | 309,932.33 | 127,211.34 | 182,720.99 |
| 08 | Manchester Central | 309,232.67 | 119,371.60 | 189,861.07 |
| 07 | London City | 265,913.09 | 107,099.25 | 158,813.84 |
| 05 | Chicago West | 253,600.69 | 107,942.03 | 145,658.66 |
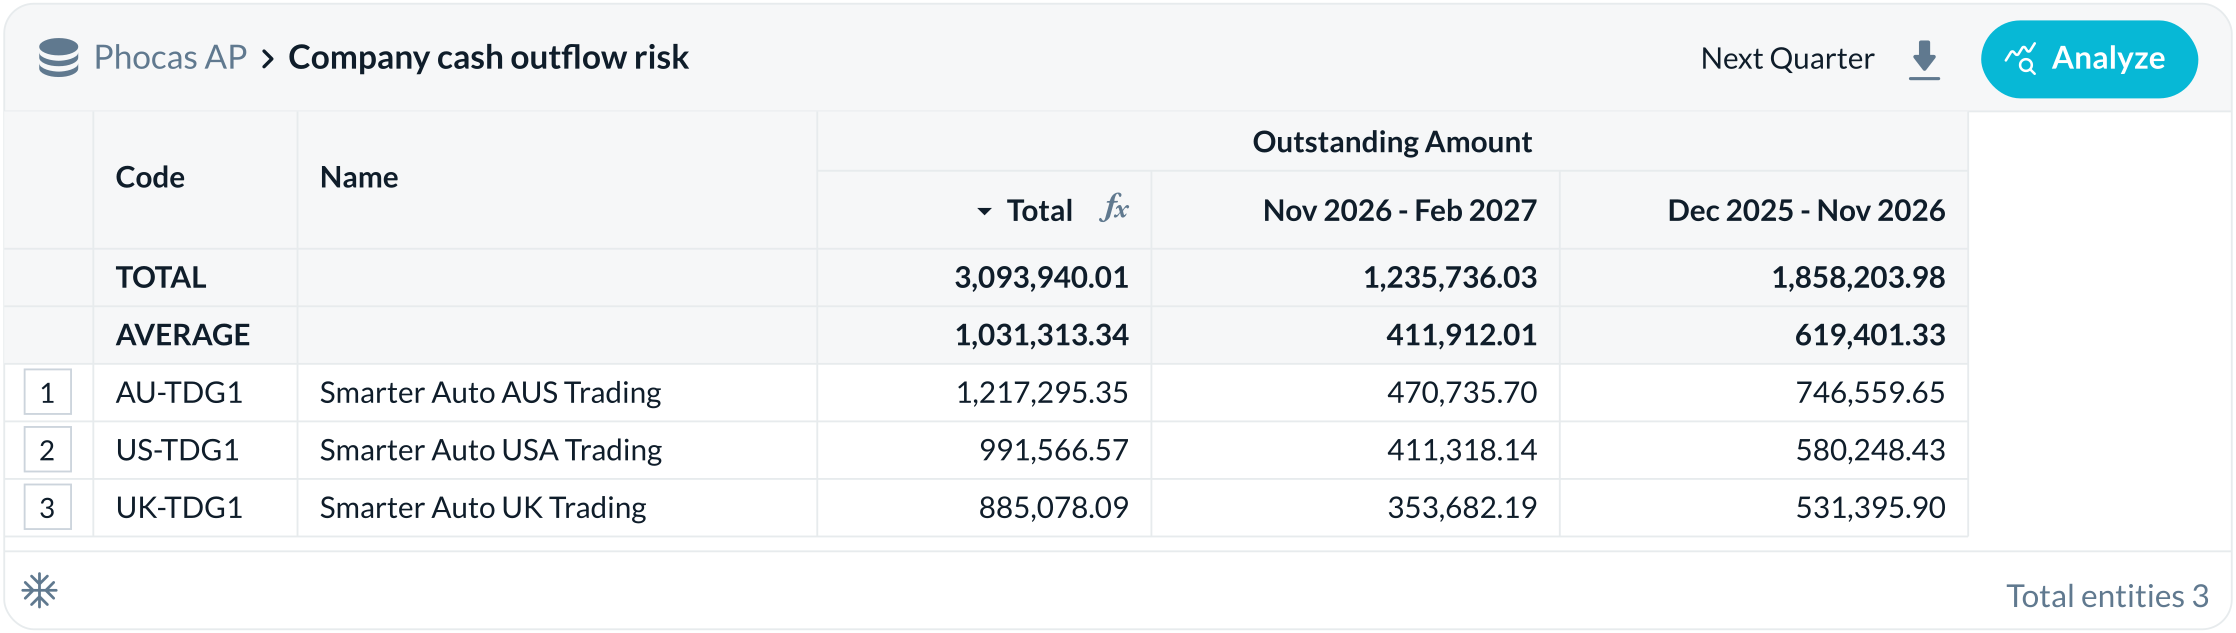
| Code | Name | Total | Nov 2026 - Feb 2027 | Dec 2025 - Nov 2026 |
|---|---|---|---|---|
| TOTAL | 3,093,940.01 | 1,235,736.03 | 1,858,203.98 | |
| AVERAGE | 1,031,313.34 | 411,912.01 | 619,401.33 | |
| AU-TDG1 | Smarter Auto AUS Trading | 1,217,295.35 | 470,735.70 | 746,559.65 |
| US-TDG1 | Smarter Auto USA Trading | 991,566.57 | 411,318.14 | 580,248.43 |
| UK-TDG1 | Smarter Auto UK Trading | 885,078.09 | 353,682.19 | 531,395.90 |
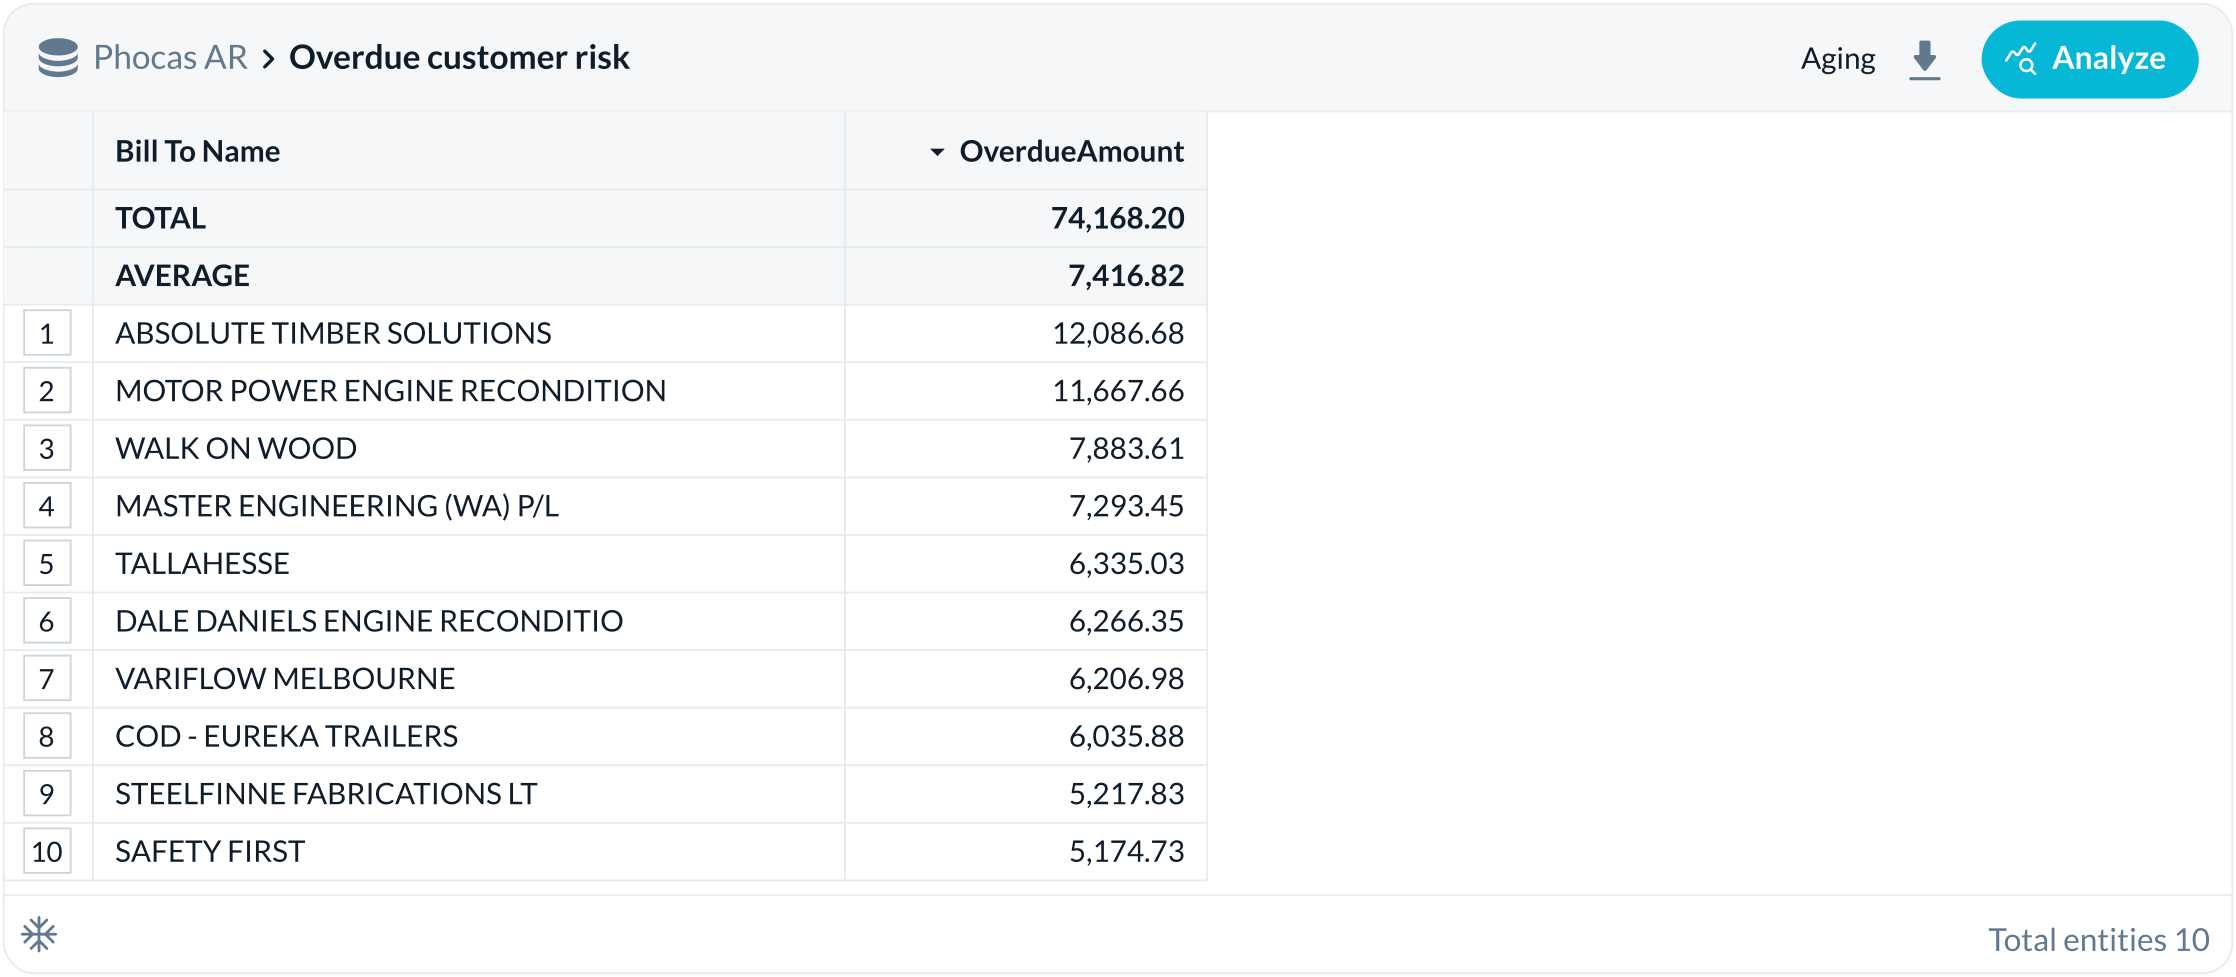
| Bill To Name | OverdueAmount |
|---|---|
| TOTAL | 74,168.20 |
| AVERAGE | 7,416.82 |
| ABSOLUTE TIMBER SOLUTIONS | 12,086.68 |
| MOTOR POWER ENGINE RECONDITION | 11,667.66 |
| WALK ON WOOD | 7,883.61 |
| MASTER ENGINEERING (WA) P/L | 7,293.45 |
| TALLAHESSE | 6,335.03 |
| DALE DANIELS ENGINE RECONDITIO | 6,266.35 |
| VARIFLOW MELBOURNE | 6,206.98 |
| COD - EUREKA TRAILERS | 6,035.88 |
| STEELFINNE FABRICATIONS LT | 5,217.83 |
| SAFETY FIRST | 5,174.73 |
Focus the next quarter on Controls, Power and Lights & Lamps—not blanket growth in Lumination. Recent sales increased by $923k overall, but the strongest quality of growth is in Controls (+$148k, +6.3 percentage points margin) and Power (+$255k, +0.6 points). Lights & Lamps remains the largest scalable opportunity at $5.37m with $1.09m profit and improving margin. Lumination is largest at $8.81m, but margin fell 2.0 points, so treat it as an improvement/repricing focus rather than the primary growth engine.
| Code | Name | Value | Profit | Margin % | |||
|---|---|---|---|---|---|---|---|
| Sept 2026 - Nov 2026 | Jun 2026 - Aug 2026 | Variance | Sept 2026 - Nov 2026 | Sept 2026 - Nov 2026 | Jun 2026 - Aug 2026 | ||
| TOTAL | 15,844,407.72 | 14,921,404.87 | 923,002.85 | 2,991,747.71 | 18.88% | 19.60% | |
| AVERAGE | 2,640,734.62 | 2,486,900.81 | 153,833.81 | 498,624.62 | 17.23% | — | |
| A | Lumination | 8,807,878.57 | 8,649,252.71 | 158,625.86 | 1,585,709.31 | 18.00% | 19.99% |
| D | Lights & Lamps | 5,370,151.47 | 5,043,122.64 | 327,028.83 | 1,089,488.25 | 20.29% | 19.39% |
| B | Power | 1,245,654.75 | 990,241.54 | 255,413.21 | 233,117.27 | 18.71% | 18.08% |
| C | Controls | 297,613.14 | 149,962.91 | 147,650.23 | 65,821.96 | 22.12% | 15.80% |
| E | Outside Lights | 120,061.79 | 88,825.07 | 31,236.72 | 17,311.12 | 14.42% | 17.27% |
| ### | 3,048.00 | 0.00 | 3,048.00 | 299.80 | 9.84% | — | |
6 product classes. — denotes an unavailable prior margin.
At SKU level, the clearest growth products are LED Lantern - BlueGU10 35mm (+$62.7k, 22.8% margin), 12SN-DLL312SN-DLL3 (+$43.4k, 33.8% margin), Lighting Accessory 120V150VA (+$42.7k, 34.6% margin), and 11SN-DLL311SN-DLL3 (+$41.4k, 25.9% margin). These should be packaged into rep campaigns and cross-sell plays.
| Code | Name | Value | Profit | ||
|---|---|---|---|---|---|
| Sept 2026 - Nov 2026 | Jun 2026 - Aug 2026 | Variance | Sept 2026 - Nov 2026 | ||
| TOTAL | 1,434,301.11 | 1,444,804.16 | -10,503.05 | 278,973.01 | |
| AVERAGE | 71,715.06 | 72,240.21 | -525.15 | 13,948.65 | |
| 109111 | Pressed Square Lantern Polished Brass c/w Accessories | 123,154.68 | 143,007.36 | -19,852.68 | 15,096.26 |
| 15 | Non-Maintain Emergency Twin Spot 240V - 2x20W | 115,016.00 | 122,658.28 | -7,642.28 | 15,725.85 |
| 106867 | 20W 10Amp Lanterns MR11 | 85,573.24 | 92,810.98 | -7,237.74 | 22,523.36 |
| 16 | LED Bath Light IP68 - 5W - Round | 83,130.39 | 140,061.05 | -56,930.66 | 17,230.11 |
| 106866 | Die-Cast Adj 3 GU10 Spot/Fluor Sus LSS GU10/TL5-C | 81,307.79 | 69,043.89 | 12,263.90 | 21,102.97 |
| 109112 | 70W 30Amp Lanterns MR11 | 76,801.44 | 107,421.96 | -30,620.52 | 8,884.53 |
| 106861 | Compact Fluorescent 7W Lantern 3000K | 76,661.01 | 123,121.01 | -46,460.00 | 15,664.59 |
| 111513 | 21pc LED Lantern - Blue GU10 35mm | 71,514.00 | 61,485.55 | 10,028.45 | 8,266.26 |
| 109242 | 12SN-DLL312SN-DLL3 | 64,932.79 | 21,557.44 | 43,375.35 | 21,922.87 |
| 109093 | Accessory 21 | 64,413.12 | 123,119.76 | -58,706.64 | 11,074.07 |
Showing 10 products. Total and average cover the full result.
Priority customers for next month: Start with accounts showing both meaningful growth and attractive profit: ASAP Metallising - AUS, Variflow Melbourne - AUS, S.D.S. Diamond & Boart - AUS, Apogee Products - AUS, and Master Engineering (WA) P/L - AUS. They combine strong recent sales increases with margin expansion, making them the best near-term targets for broader product penetration.
Also put Roy Wilkins Industries - AUS on the priority list: it generated $132.0k recently with 23.3% margin but has no comparable prior-period sales, so it is a high-potential account requiring rapid follow-up. Use Motor Power Engine Recondition - UK, Motor Power Engine Recondition - USA, and Tallahesse - UK/USA as recovery accounts rather than pure growth targets: their sales are material, but margin has deteriorated by 6.7–10.4 points.
The priority action is to deploy the strongest growth SKUs into the expanding Australian accounts first, while requiring price or mix reviews before increasing volume in the margin-deteriorating accounts. This recommendation uses the latest rolling three-month performance as a proxy for next-month and next-quarter opportunity; it is not a formal forecast.
| Name | Value | Profit | Margin % | ||
|---|---|---|---|---|---|
| Sept 2026 - Nov 2026 | Jun 2026 - Aug 2026 | Variance | Sept 2026 - Nov 2026 | Sept 2026 - Nov 2026 | |
| TOTAL | 2,717,153.91 | 2,020,663.80 | 696,490.11 | 484,842.55 | 17.84% |
| AVERAGE | 135,857.70 | 106,350.73 | 29,506.97 | 24,442.13 | 17.88% |
| MOTOR POWER ENGINE RECONDITION - UK | 185,418.85 | 105,838.66 | 79,580.19 | 22,728.80 | 12.26% |
| MOTOR POWER ENGINE RECONDITION - AUS | 184,539.97 | 163,845.41 | 20,694.56 | 29,455.59 | 15.96% |
| ASAP METALLISING - AUS | 176,069.73 | 94,151.00 | 81,918.73 | 39,074.70 | 22.19% |
| TALLAHESSE - AUS | 168,052.84 | 125,858.38 | 42,194.46 | 31,121.88 | 18.52% |
| STEELFINNE FABRICATIONS LT - AUS | 164,484.59 | 129,018.76 | 35,465.83 | 32,580.99 | 19.81% |
| TALLAHESSE - UK | 148,136.07 | 115,220.81 | 32,915.26 | 19,828.37 | 13.39% |
| MASTER ENGINEERING (WA) P/L - AUS | 147,285.75 | 119,643.83 | 27,641.92 | 33,131.81 | 22.49% |
| ASAP METALLISING - UK | 137,464.37 | 94,454.18 | 43,010.19 | 26,015.47 | 18.93% |
| ROY WILKINS INDUSTRIES - AUS | 132,029.03 | — | 132,029.03 | 30,766.20 | 23.30% |
| MOTOR POWER ENGINE RECONDITION - USA | 130,478.56 | 112,376.37 | 18,102.19 | 16,153.51 | 12.38% |
| VARIFLOW MELBOURNE - AUS | 129,462.62 | 63,070.03 | 66,392.59 | — | — |
Showing 11 customers. Total and average cover the full result; — denotes an unavailable value.
Built an unsaved next-quarter growth priorities dashboard with headline sales and profit KPIs, product and product-class priorities, customer opportunities, and sales-rep ownership priorities.
Total sales value across the rep priority view
12M
Total profit across the rep priority view
2M
| Code | Name | Value | Profit | Margin % | |||
|---|---|---|---|---|---|---|---|
| Sept 2026 - Nov 2026 | Jun 2026 - Aug 2026 | Variance | Sept 2026 - Nov 2026 | Sept 2026 - Nov 2026 | Jun 2026 - Aug 2026 | ||
| TOTAL | 15,844,407.72 | 14,921,404.87 | 923,002.85 | 2,991,747.71 | 18.88% | 19.60% | |
| AVERAGE | 2,640,734.62 | 2,486,900.81 | 153,833.81 | 498,624.62 | 17.23% | — | |
| A | Lumination | 8,807,878.57 | 8,649,252.71 | 158,625.86 | 1,585,709.31 | 18.00% | 19.99% |
| D | Lights & Lamps | 5,370,151.47 | 5,043,122.64 | 327,028.83 | 1,089,488.25 | 20.29% | 19.39% |
| B | Power | 1,245,654.75 | 990,241.54 | 255,413.21 | 233,117.27 | 18.71% | 18.08% |
| C | Controls | 297,613.14 | 149,962.91 | 147,650.23 | 65,821.96 | 22.12% | 15.80% |
| E | Outside Lights | 120,061.79 | 88,825.07 | 31,236.72 | 17,311.12 | 14.42% | 17.27% |
| ### | 3,048.00 | 0.00 | 3,048.00 | 299.80 | 9.84% | — | |
6 product classes. — denotes an unavailable prior margin.
| Code | Name | Value | Profit | ||
|---|---|---|---|---|---|
| Sept 2026 - Nov 2026 | Jun 2026 - Aug 2026 | Variance | Sept 2026 - Nov 2026 | ||
| TOTAL | 1,434,301.11 | 1,444,804.16 | -10,503.05 | 278,973.01 | |
| AVERAGE | 71,715.06 | 72,240.21 | -525.15 | 13,948.65 | |
| 109111 | Pressed Square Lantern Polished Brass c/w Accessories | 123,154.68 | 143,007.36 | -19,852.68 | 15,096.26 |
| 15 | Non-Maintain Emergency Twin Spot 240V - 2x20W | 115,016.00 | 122,658.28 | -7,642.28 | 15,725.85 |
| 106867 | 20W 10Amp Lanterns MR11 | 85,573.24 | 92,810.98 | -7,237.74 | 22,523.36 |
| 16 | LED Bath Light IP68 - 5W - Round | 83,130.39 | 140,061.05 | -56,930.66 | 17,230.11 |
| 106866 | Die-Cast Adj 3 GU10 Spot/Fluor Sus LSS GU10/TL5-C | 81,307.79 | 69,043.89 | 12,263.90 | 21,102.97 |
| 109112 | 70W 30Amp Lanterns MR11 | 76,801.44 | 107,421.96 | -30,620.52 | 8,884.53 |
| 106861 | Compact Fluorescent 7W Lantern 3000K | 76,661.01 | 123,121.01 | -46,460.00 | 15,664.59 |
| 111513 | 21pc LED Lantern - Blue GU10 35mm | 71,514.00 | 61,485.55 | 10,028.45 | 8,266.26 |
| 109242 | 12SN-DLL312SN-DLL3 | 64,932.79 | 21,557.44 | 43,375.35 | 21,922.87 |
| 109093 | Accessory 21 | 64,413.12 | 123,119.76 | -58,706.64 | 11,074.07 |
Showing 10 products. Total and average cover the full result.
| Name | Value | Profit | Margin % | ||
|---|---|---|---|---|---|
| Sept 2026 - Nov 2026 | Jun 2026 - Aug 2026 | Variance | Sept 2026 - Nov 2026 | Sept 2026 - Nov 2026 | |
| TOTAL | 2,717,153.91 | 2,020,663.80 | 696,490.11 | 484,842.55 | 17.84% |
| AVERAGE | 135,857.70 | 106,350.73 | 29,506.97 | 24,442.13 | 17.88% |
| MOTOR POWER ENGINE RECONDITION - UK | 185,418.85 | 105,838.66 | 79,580.19 | 22,728.80 | 12.26% |
| MOTOR POWER ENGINE RECONDITION - AUS | 184,539.97 | 163,845.41 | 20,694.56 | 29,455.59 | 15.96% |
| ASAP METALLISING - AUS | 176,069.73 | 94,151.00 | 81,918.73 | 39,074.70 | 22.19% |
| TALLAHESSE - AUS | 168,052.84 | 125,858.38 | 42,194.46 | 31,121.88 | 18.52% |
| STEELFINNE FABRICATIONS LT - AUS | 164,484.59 | 129,018.76 | 35,465.83 | 32,580.99 | 19.81% |
| TALLAHESSE - UK | 148,136.07 | 115,220.81 | 32,915.26 | 19,828.37 | 13.39% |
| MASTER ENGINEERING (WA) P/L - AUS | 147,285.75 | 119,643.83 | 27,641.92 | 33,131.81 | 22.49% |
| ASAP METALLISING - UK | 137,464.37 | 94,454.18 | 43,010.19 | 26,015.47 | 18.93% |
| ROY WILKINS INDUSTRIES - AUS | 132,029.03 | — | 132,029.03 | 30,766.20 | 23.30% |
| MOTOR POWER ENGINE RECONDITION - USA | 130,478.56 | 112,376.37 | 18,102.19 | 16,153.51 | 12.38% |
| VARIFLOW MELBOURNE - AUS | 129,462.62 | 63,070.03 | 66,392.59 | — | — |
Showing 11 customers. Total and average cover the full result; — denotes an unavailable value.
Package the growth SKUs into campaigns for ASAP Metallising - AUS, Variflow Melbourne - AUS, S.D.S. Diamond & Boart - AUS, Apogee Products - AUS and Master Engineering (WA) P/L - AUS.
Prioritize Roy Wilkins Industries - AUS: $132.0k in recent sales at 23.3% margin, with no comparable prior-period sales.
Review price and mix for Motor Power Engine Recondition - UK and USA, and Tallahesse - UK/USA, before increasing volume.
Assign these actions to each account’s sales rep.
Join us as we walk through what's new, why we built it, and how it changes the way you work.
What we'll cover:
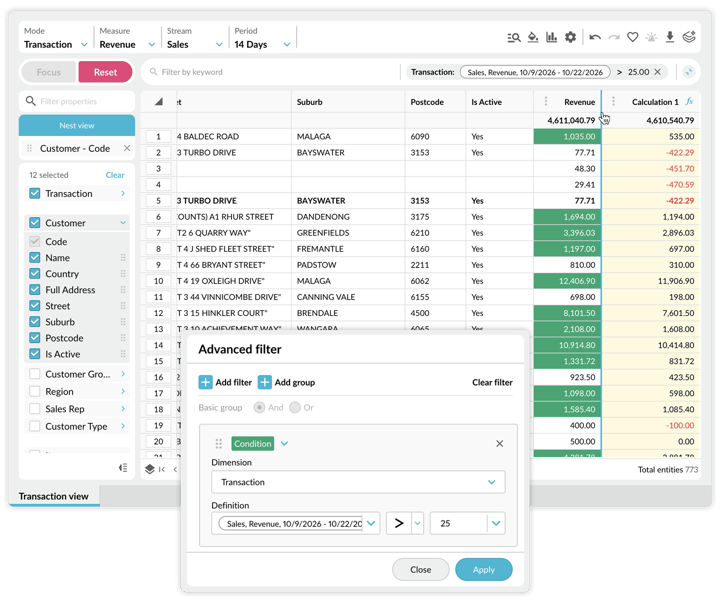
Richer analysis, right where you already work. Everything you know about the grid, now faster - custom columns, conditional formatting, transaction-level detail, sharper search, and an upgraded alerts experience.
The Next Generation of Phocas Dashboards. Faster to build, more personalized, and easier to explore - full branding, dark mode, new chart and widget types, built for every screen from a warehouse wall display to your phone.
Workspaces, powered by PACE. This is AI grounded in your own trusted data - follow your train of thought, dig into the "why" behind a number, and get actionable, strategic insights without waiting on a report or worrying about data security.
Getting started, when you're ready. How to turn it on, tips to get started and where to go if you want a hand along the way.
Plus, real customer results: what’s changed since they made the switch.
Register now to see it live, first.


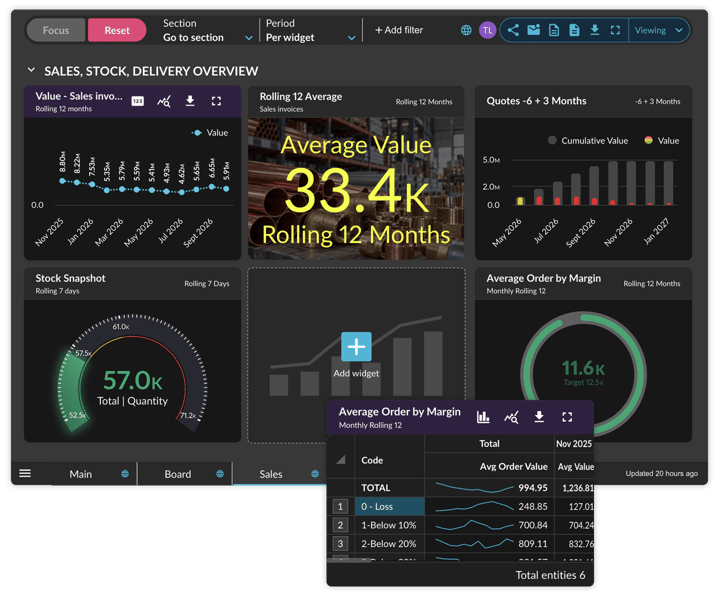
Faster and easier to create and share, better at making data more impactful.
Formerly known as Flex Modes. Deeper ad hoc analysis and more flexible reporting anyone can use.
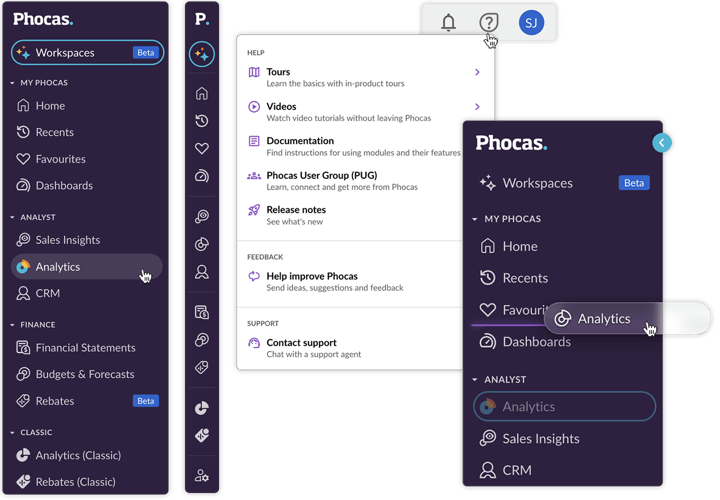
A simpler way to get to the tools you use most, wherever you are in Phocas.
Popular search terms
When you visit any website, it may store or retrieve information in your browser, mostly in the form of cookies. This information might be about you, your preferences or your device and the primary purpose is to ensure the website functions as you expect it to. While this information typically doesn't directly identify you, it contributes to a more personalized browsing experience. Because we respect your right to privacy, we provide the option to control certain types of cookies. Click on the different category headings below to learn more and modify our default settings according to your preferences. However, blocking some types of cookies might impact your experience of the website and the services we are able to offer.
