Sales analytics & forecasting
Drive growth with data analytics and sales forecasting
Empower your team with intuitive tools to analyze sales performance, identify trends, and forecast with confidence. With Phocas, actionable insights are at your fingertips, helping you drive revenue growth and improve sales strategies.

Sell smarter, faster
- Salespeople live and breathe numbers; empower them with faster, easier access to up-to-date sales data
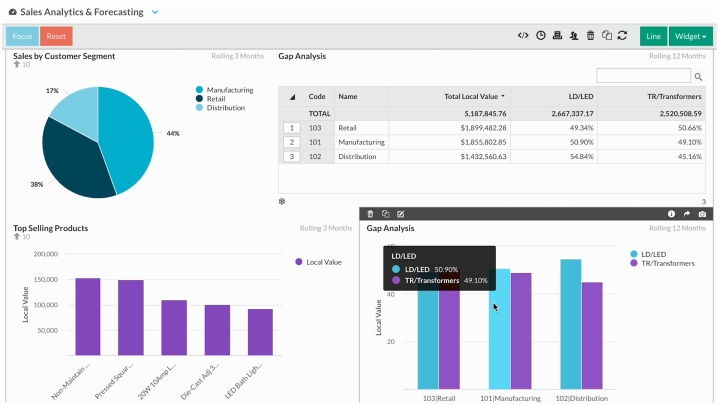
- Identify key focus areas, uncover sales trends, gap analysis and adjust your sales strategy accordingly
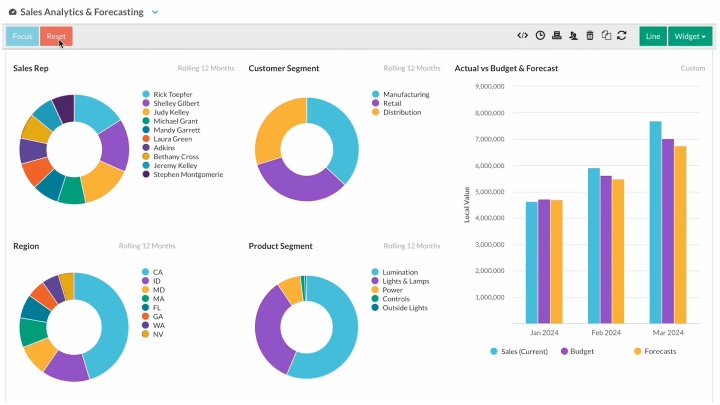
- Transform numbers into actionable insights with sales dashboards, charts and graphs, helping team members achieve targets and improve overall sales performance.
Drive growth
- Speed up sales cycles by quickly identifying top-selling products for new and existing customers
- Drill into customer detail to identify which sales reps, regions, products are contributing to conversion rates
- Make it easy to track sales rep performance so you're always up to speed and know where to troubleshoot underperformance.
Customer quote
"Our sales and marketing teams use Phocas to nail opportunities. Last month we identified the healthcare sector was producing some outstanding results. So, we were able to divert some of our sales effort away from low performing sectors into those that appeared to be more lucrative. That was really good."
— Howard Barr, General Manager at Woodberry.
Sage + Phocas customer
Analytics in action: Take a video tour
See Analytics put to work through a series of short videos. Highlighting common pain points and the specific solutions Phocas delivers.
-

Quick and easy access to data
Learn how you can get quick and easy access to the information you need to make data-driven decisions with trusted data that’s pulled fresh from your ERP. -

Self-serve reports and alerts
Break-free of the cycle of back-and-forth report requests and revisions with IT. Take a look at how easy it is to set up reports and alerts in Phocas. -

Drill down and follow your train of thought
Learn how Phocas lets you drill into your data to get super-fast answers and understand what is happening and why. -

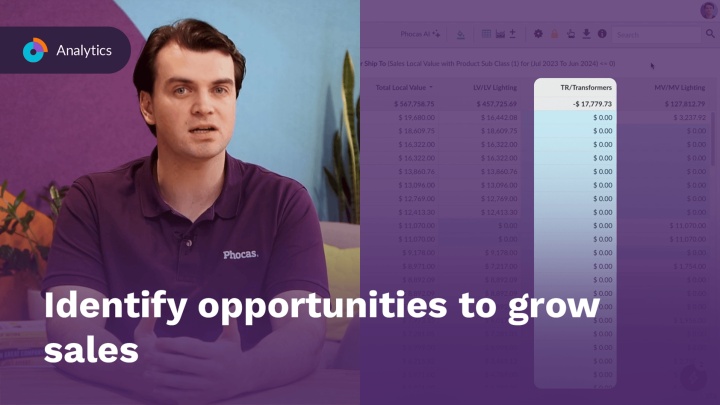
Identify opportunities to grow sales
See how Phocas can grow sales by helping your reps quickly identify easy wins, such as cross-sell opportunities in a few clicks. -

Track profitability of sales
With Phocas you can easily track the actual margins you’re making and identify customers who may be less profitable than they first appear. -

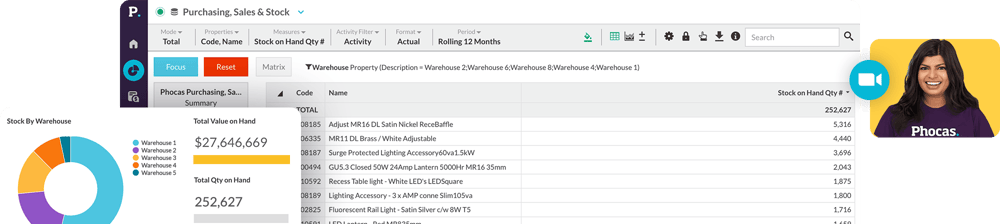
Optimize stock
Forget managing stock using your ERP or spreadsheets – see how Phocas makes it super easy to stay on top of your inventory. -

Phocas AI
Discover how Phocas AI helps you uncover insights quickly helping you drive impact across your business.
Stay on track
- Tap into historical data, seasonal data, current trends and actual sales performance to create more accurate sales forecasts
- Drive sales forecasts into financial budgets and inventory plans
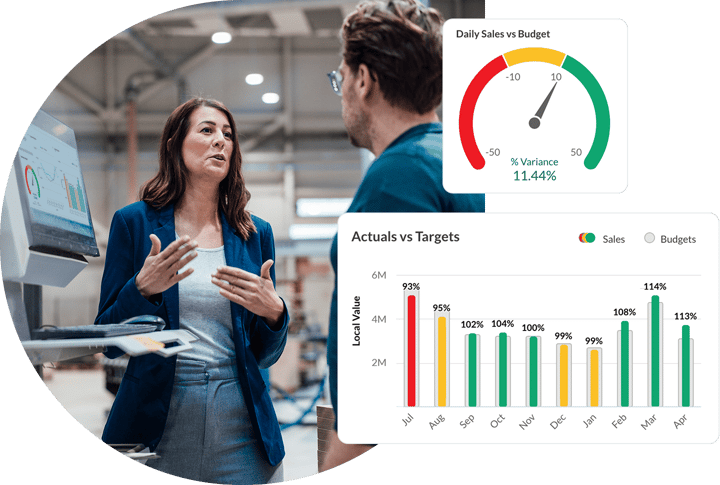
- Easy access to real-time data allows you to monitor sales performance against budget on a daily basis, enabling fast decision-making in response to changing market conditions
- Regular access to live actuals empowers sales teams to be agile in adjusting sales strategies to drive growth.
Customizable sales forecasts
- Forecast sales any way you like - by sales rep, region, product, customer segment
- Tailor sales forecasts to specific business needs and analyze performance from different perspectives
- Spot areas for improvement
- Drill into underlying sales data for a granular view of sales projections, or view overall sale performance.
Everyday tracking is so simple
The team at Bowens use Phocas every day. Why, because it's so simple to use and they're no longer relying on 'gut feel'. Everyone can quickly access up-to-date sales data, break it down and identify opportunities and areas for improvement.
Get a demo
Hear from Luke
Customer quote
“Phocas helps us nail down each one of our account managers on areas to be stronger in. We’ve improved sales and our customer service. We’ve improved both by using Phocas.”
Luke McEnaney
Group Sales Manager
Bowens
Bowens


Make sales analysis easy
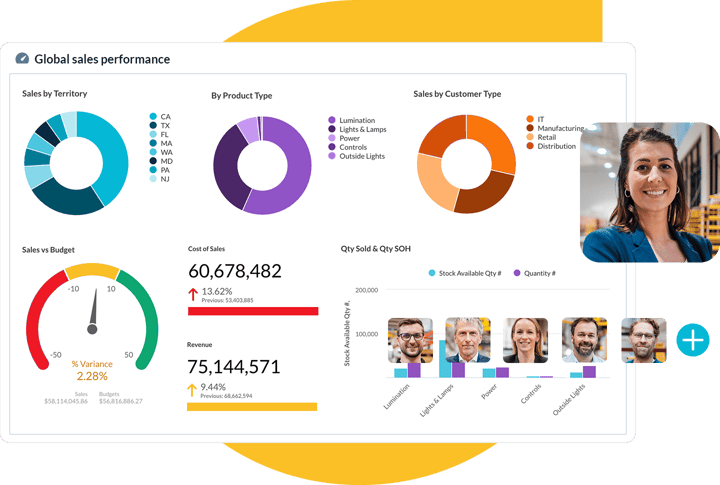
- Empower your reps with easy-to-use data tools, customized scorecards and all-in-one dashboards to enhance customer conversations
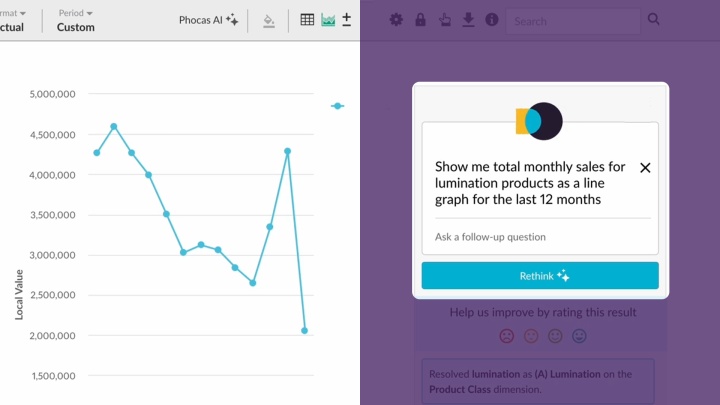
- Ask Phocas AI to query your data using natural language prompts for instant results
- Human-friendly analytics empowers sales teams to prioritize product and market focus based on real-time sales data
- Leverage visual dashboards to make strategic moves, update sales priorities and figure out what is and isn't working.
Customer quote
"Our directors, managers, and sales team, use Phocas on a daily basis. Our sales representatives use Phocas when visiting customers. It has reached deeply into our sales process in a short space of time. It really strengthens the truth of our customer conversations, removing all of the anecdotal stuff. Phocas is self-service, intuitive, easy, quick, and does what it says on the tin.”
— Ian Brady, Systems Manager at Serfac.
Klipboard + Phocas customer
Boost sales and forecast your growth with one platform


Track sales activity and success like never before
Provide critical sales data across your organization and help your executives, operations, marketing and management teams get a clear understanding of sales performance with insightful reporting tools. Streamline the process with personalized scorecards and report automation, making it easy to manage, reward and troubleshoot.
Featured Guide
Reach sales targets and boost your team's productivity
Improve your sales process with a data platform.
Download now
Understand the past, operate better today, and plan well for the future
Whether you want to get your data organized for your team or you’re looking to combine business intelligence capabilities with financial reporting, planning and forecasting… We can help.
Get a demo