What is stock cover?
Find out how our platform gives you the visibility you need to get more done.
Get your demo todayWhat is stock cover?
Stock cover estimates how long current inventory will last at a stated rate of sales or demand. It is normally expressed as a duration, such as weeks or months.
A distributor can use stock cover to compare available stock with the demand expected before the next replenishment arrives. The measure is useful at product and location level because a healthy total inventory balance can hide a shortage in one branch and excess stock in another.
How do you calculate weeks of cover?
A simple quantity-based calculation is weeks of cover = usable stock on hand ÷ average weekly demand. Use the same unit of measure in both inputs and state the demand period or forecast basis.
Illustrative example: a branch has 240 usable units and expects demand of 40 units a week. Its stock cover is six weeks. If supplier lead time is eight weeks, the stock on hand alone will not cover expected demand until a new order could arrive. Check confirmed inbound deliveries, stock commitments and the required service level before deciding what to buy.
If demand is zero or missing, do not present a division error or an arbitrary cover value. Flag the item for review.
Should stock cover use historical sales or a forecast?
Historical sales offer a simple starting point, but the selected period may not reflect seasonality, a new customer contract or changing buying patterns. A forward-looking demand estimate can be more useful when the business expects conditions to change. Label which basis is used.
Review stock availability as well as sales history. A period with stockouts may show low sales because the product was unavailable, not because underlying demand was weak. Compare branches and product groups only when the units, time basis and inclusion rules are consistent.
Is stock cover the same as inventory days of supply?
The terms are sometimes used loosely, but their inputs can differ. Current stock cover uses today’s available quantity against a stated sales or demand rate. A historical financial days-of-supply measure may use average inventory value and cost of goods sold over a reporting period.
Do not treat those results as interchangeable without checking the formula. Label the duration, stock basis, demand or cost basis and reporting period. Inventory turnover is another related measure: it describes how often inventory turns during a period, rather than how long the current stock is expected to last.
How can distributors use stock cover?
Review cover alongside supplier lead time, purchase orders, customer commitments and the risk of slow-moving stock. A single target for every SKU can hide important differences in supply reliability and customer demand.
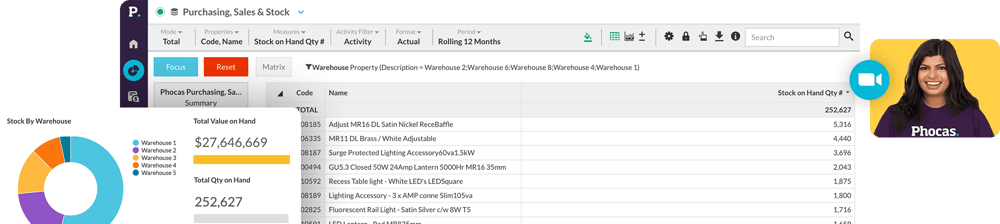
Phocas stock-visibility content explains how teams can view weeks of cover with stock on hand and sales quantity at product, warehouse or supplier level. An appropriate cover target depends on the product, supplier lead time and operating context.
Understand the past, operate better today, and plan well for the future