Explain the variance, don't just log it
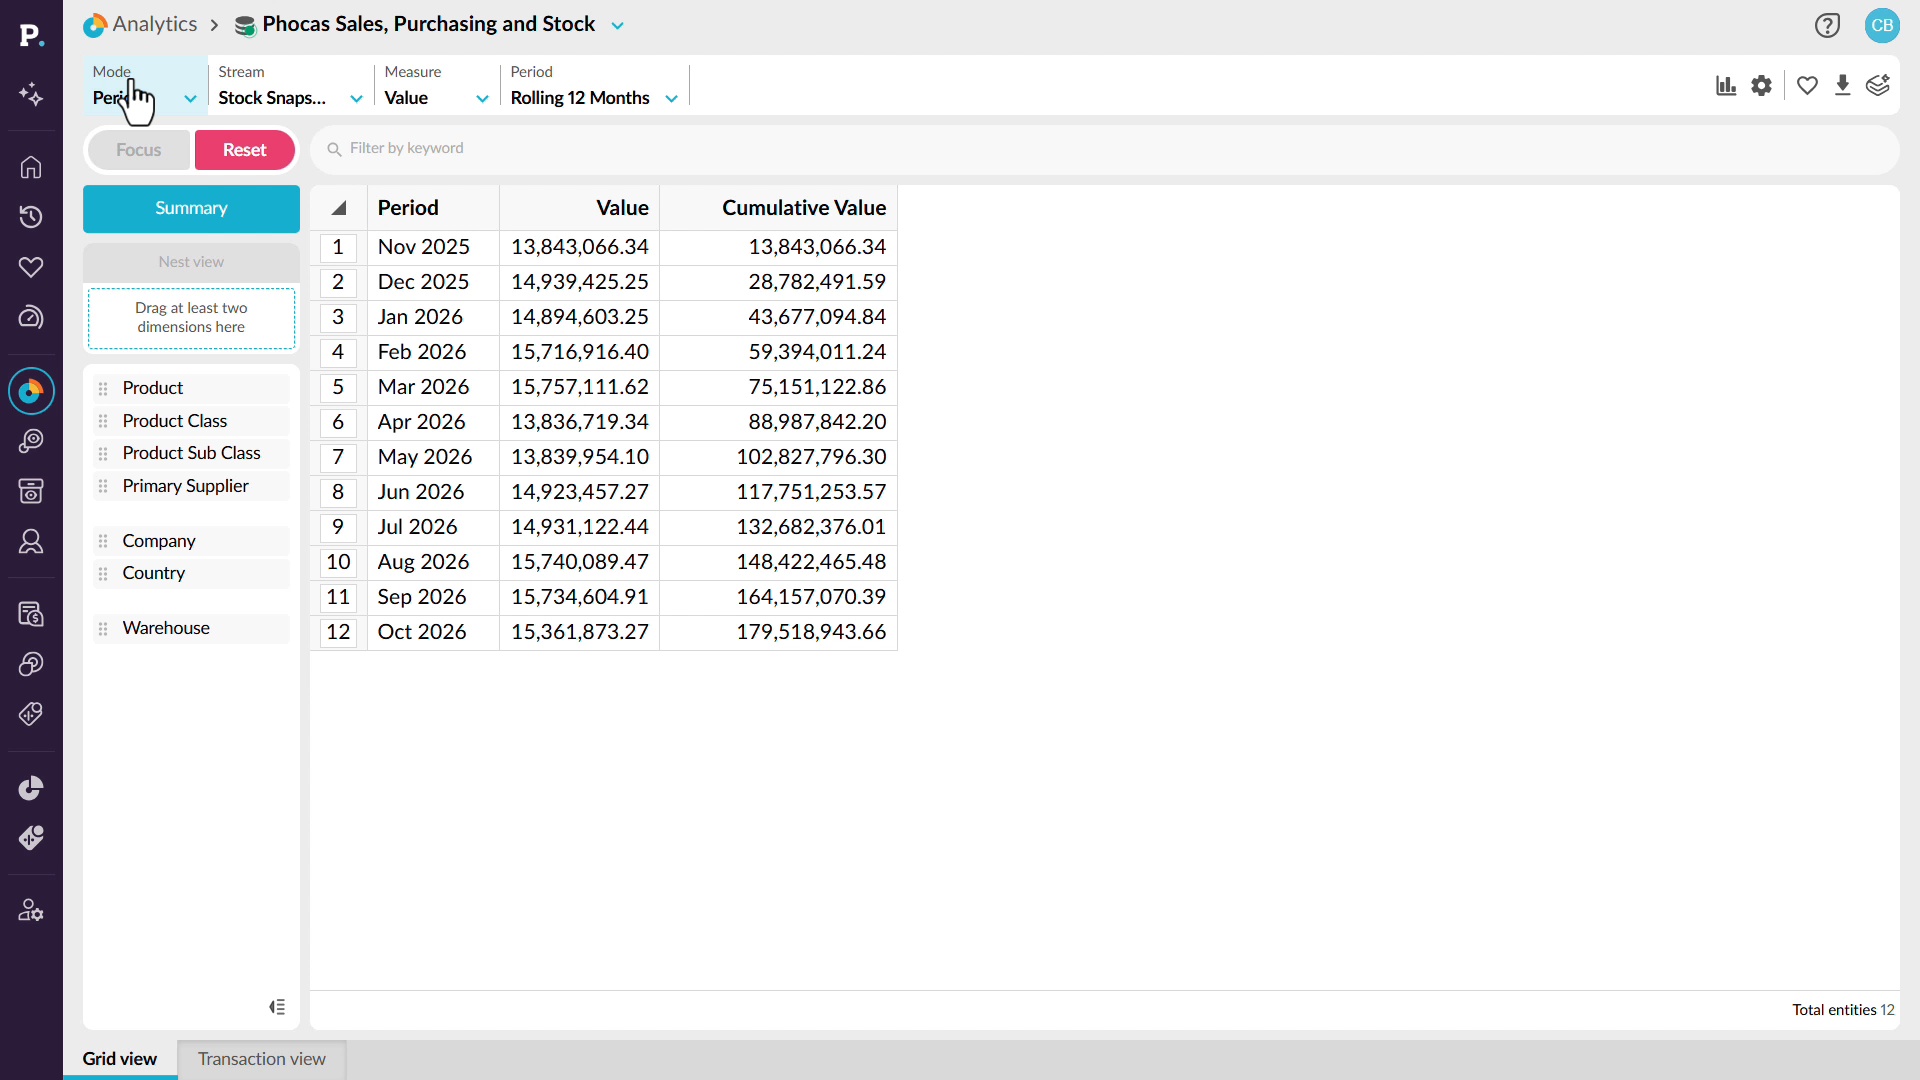
Get to the bottom of inventory discrepancies instead of repeatedly writing off unexplained variances. See how to use stock snapshots and historical inventory data to investigate changes over a rolling twelve-month period. By switching between data streams, variance analysis, and product dimensions, you can identify where the largest differences occur and drill into the underlying detail. Depending on the data available, you can investigate discrepancies by product, warehouse location, bin, or user. This helps you uncover patterns behind stock variances, understand potential causes of shrinkage, and address recurring inventory issues before they continue costing your business money.
Supporting documentation
 Analytics

Related video tutorials
 Analytics (Classic)
Compare multiple data streams
 Analytics
Stop losing stock to silence
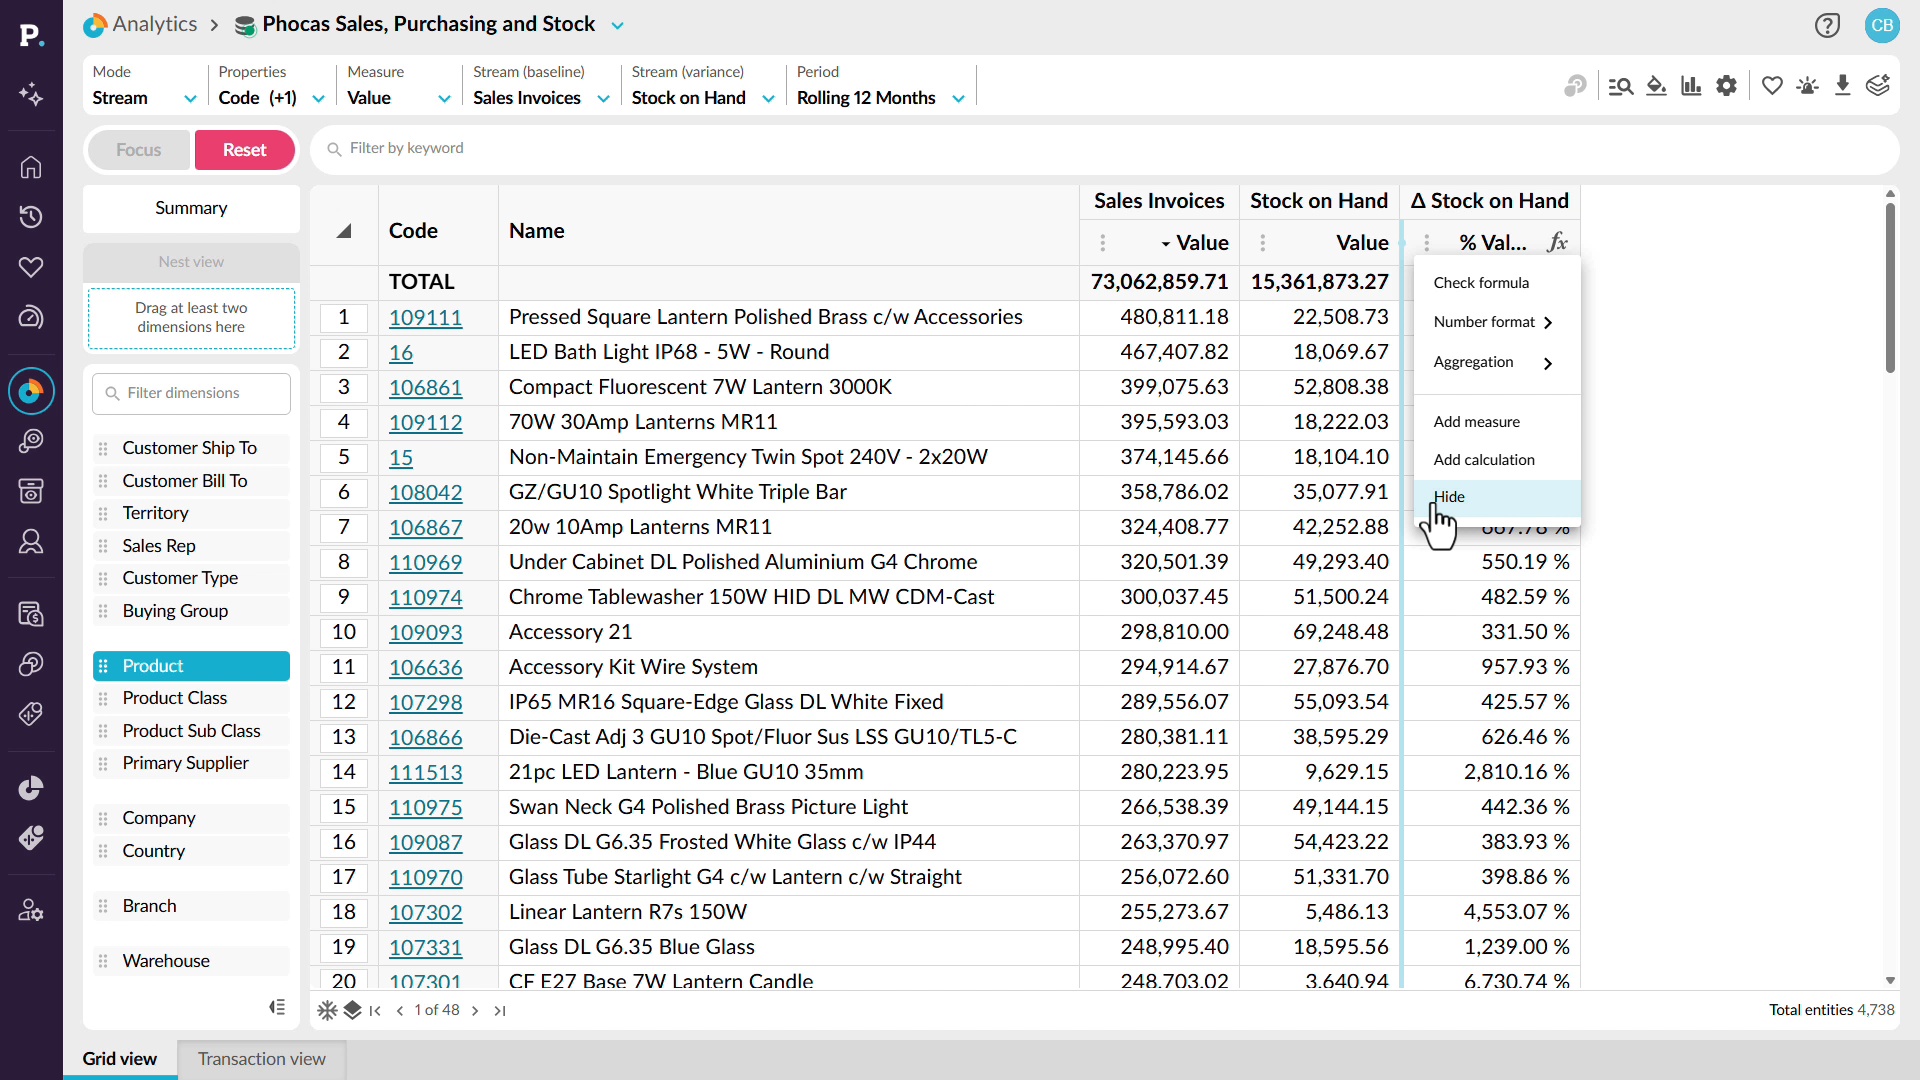
Identify dead stock and slow-moving inventory before it ties up more cash and warehouse space. See how to combine sales and stock information in the same analysis, then filter for products with no sales activity but stock still on hand. You can sort the results to find your biggest inventory concerns and save the analysis as a favorite, add it to a dashboard, or create an alert. You'll also see how to build custom inventory calculations using sales and stock measures, then compare results across different reporting periods. This gives you a clearer picture of stock movement and helps you make informed purchasing and inventory decisions.
 Analytics
Know your weeks of cover
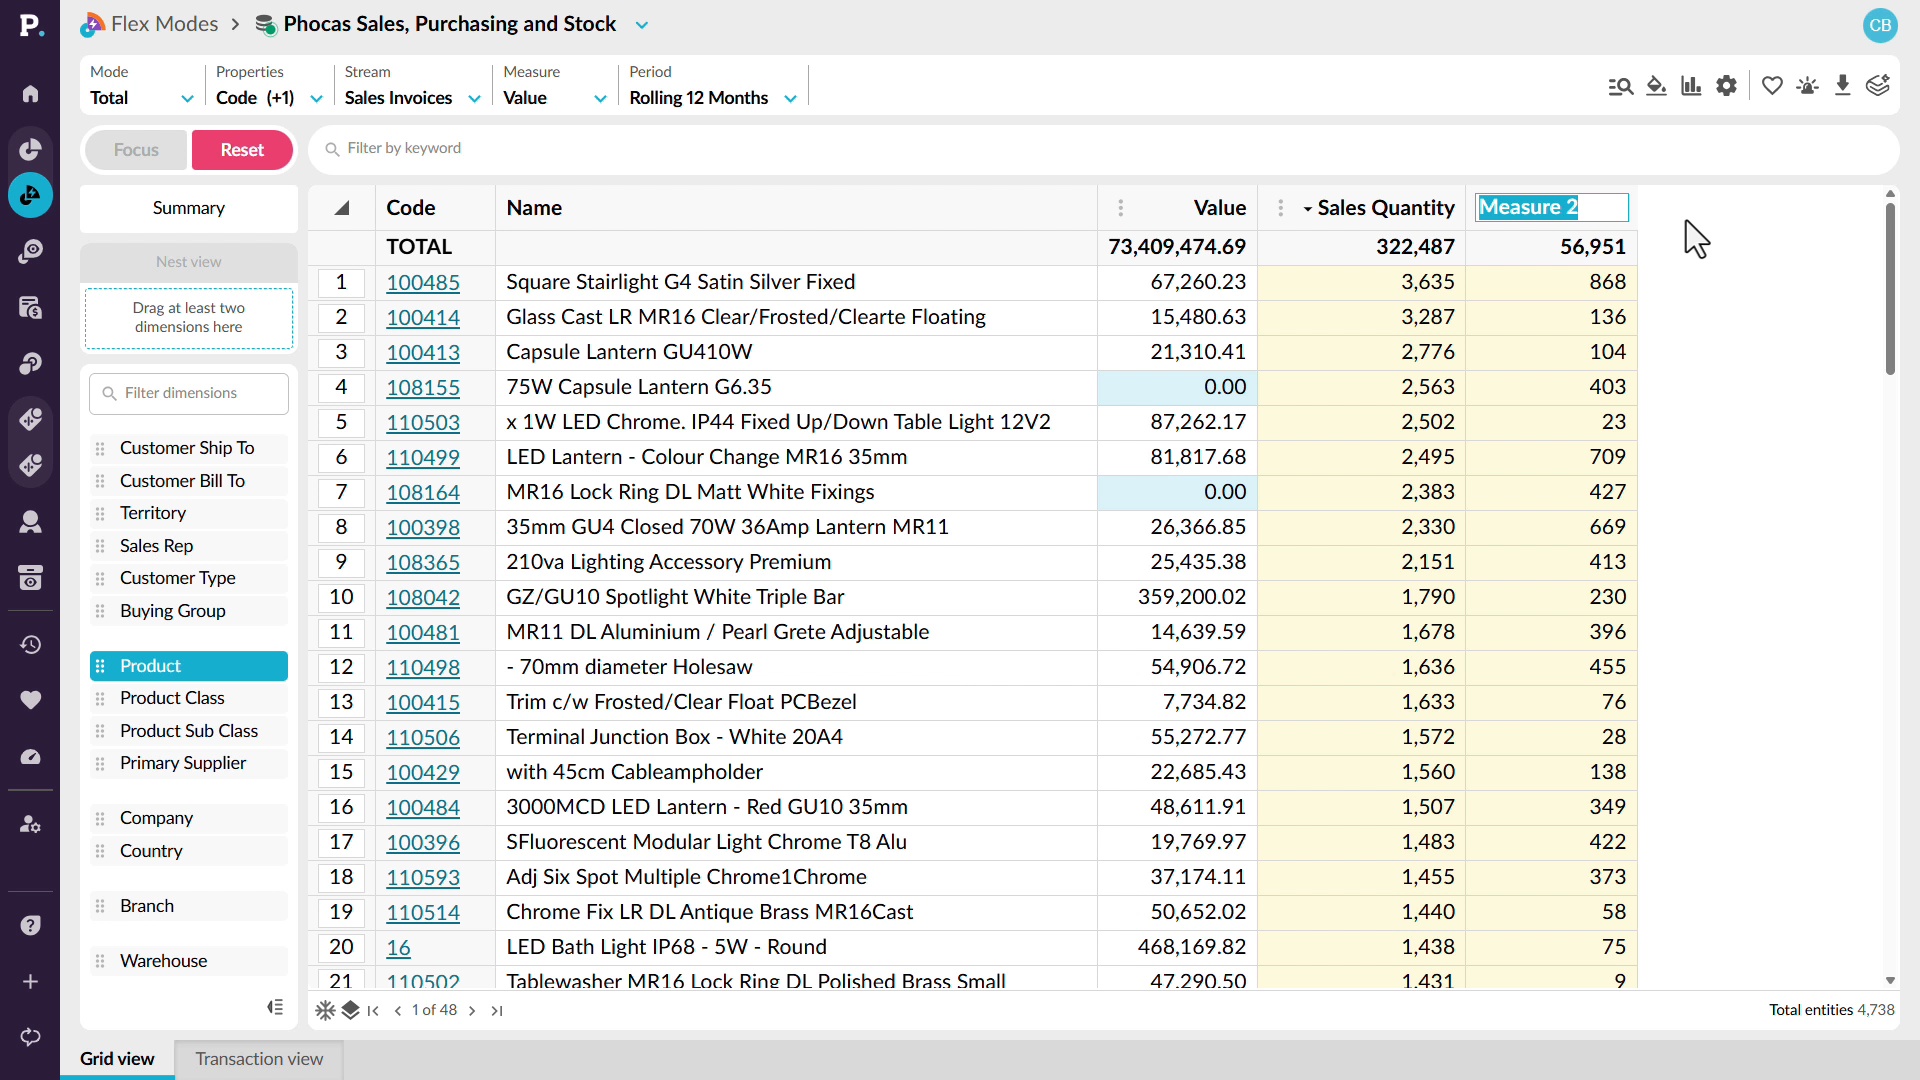
Bring sales, purchasing, and stock information together to get a clearer view of your inventory position. See how to add measures such as sales quantity and stock on hand, then use those values to create calculations directly in the grid. You’ll also see how to build measures such as weeks of cover and stock turnover, and adapt the calculations for different reporting periods. Because the results use the data already in your analysis, they update as new ERP data becomes available.
 Analytics
Stop waiting on an answer
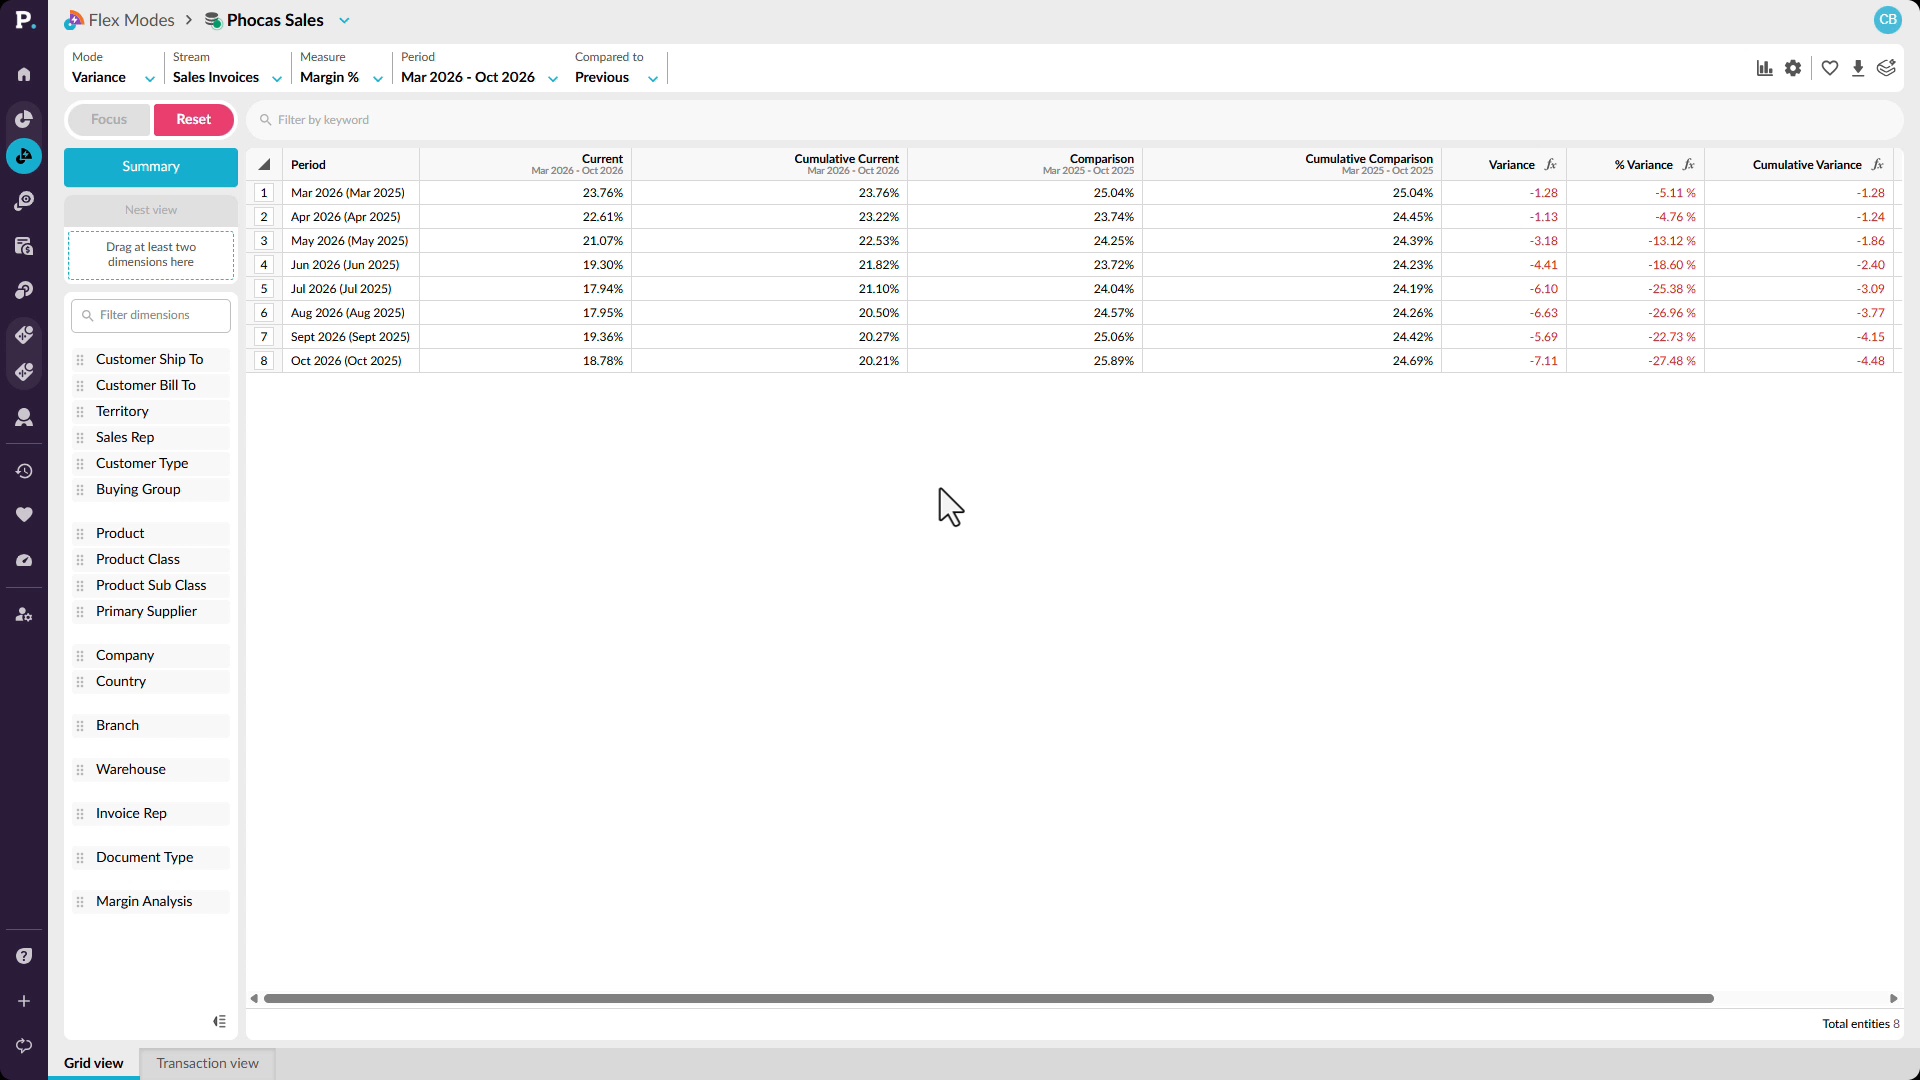
Trace a change in margin from the overall trend down to the customers and transactions behind it. Start by comparing margin percentage across rolling 12-month periods, then narrow the analysis to the months where performance has declined. From there, see how to identify customers contributing to the negative variance and move into transaction-level detail. You can bring in additional information such as salespeople, products, and product classes to keep investigating the cause, helping you answer questions about a margin anomaly without waiting for a separate report.
