Find where the value really is
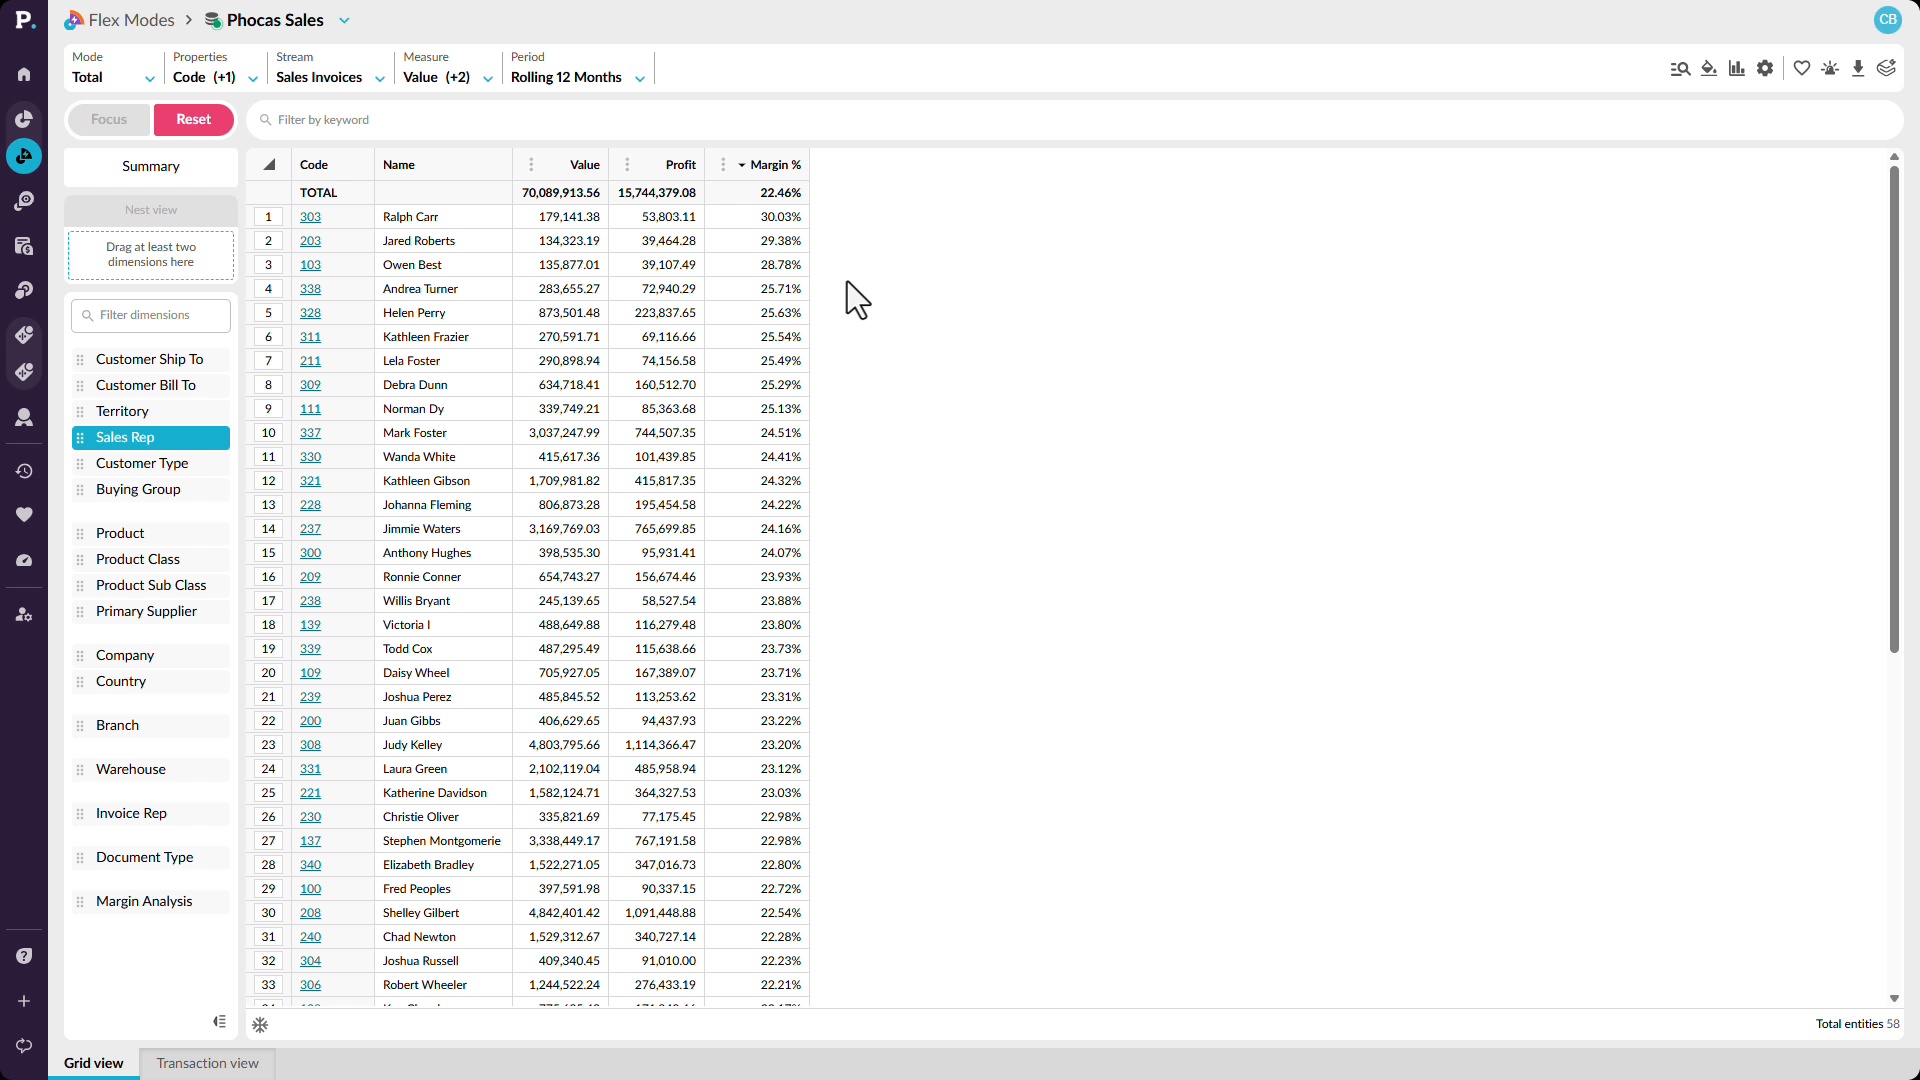
Look beyond revenue to understand which customers, sales reps, products, or locations are actually contributing the most value. See how to add profit and margin percentage alongside sales, identify changes in margin over time, and break the results down by sales rep. You can compare high-revenue performers with those delivering stronger margins, then focus on a particular rep and continue drilling into product categories and individual products. This helps reveal where strong sales are also profitable, and where apparently good performance may be hiding weaker margins.
Supporting documentation
 Analytics

Related video tutorials
 Analytics
See margin next to every sale
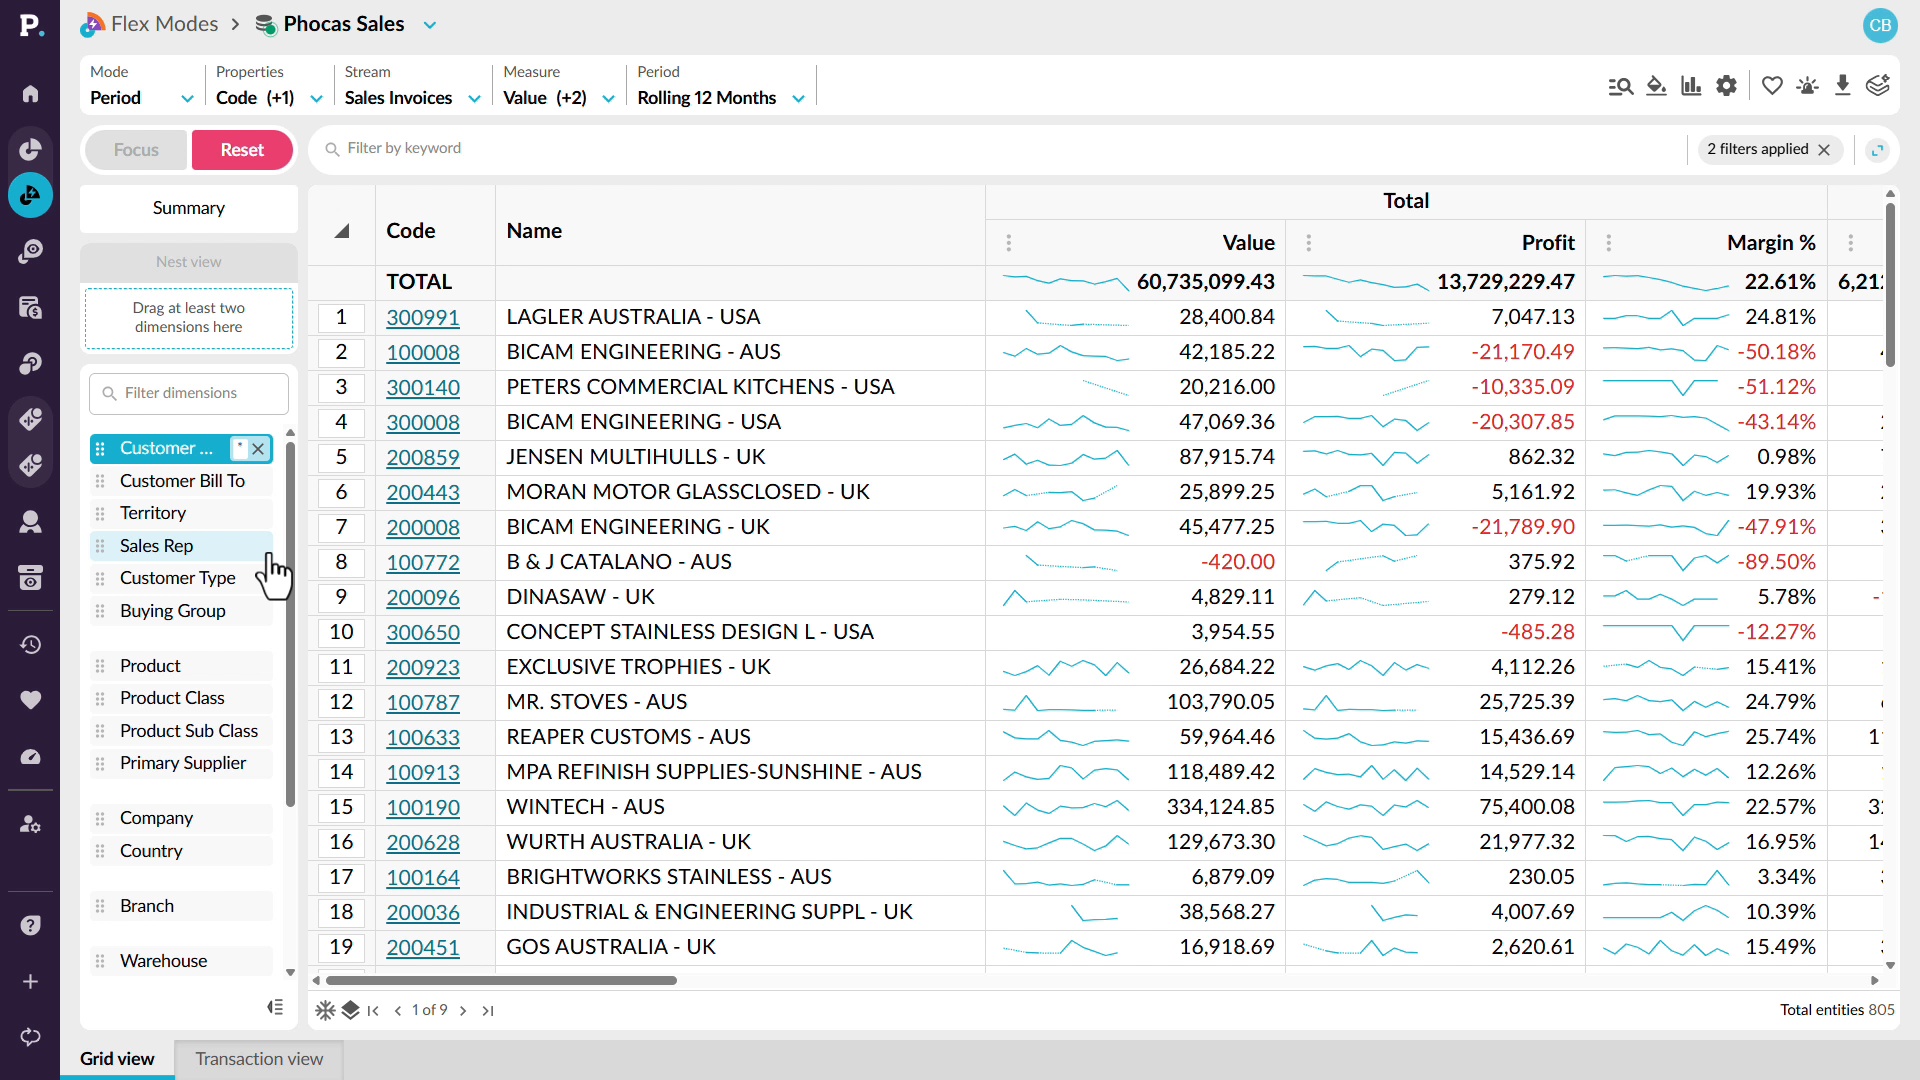
Look beyond sales revenue to understand the profitability behind your results. See how to add profit and margin alongside sales so you can compare revenue and profitability in the same analysis. You can identify periods where margin is falling, move into customer-level detail, and sort the results to find the accounts contributing most to the change. From there, drill into the underlying transactions to identify low-margin or unprofitable sales and review the discounts or individual transactions behind them.
 Analytics
See cross-sell gaps across every account
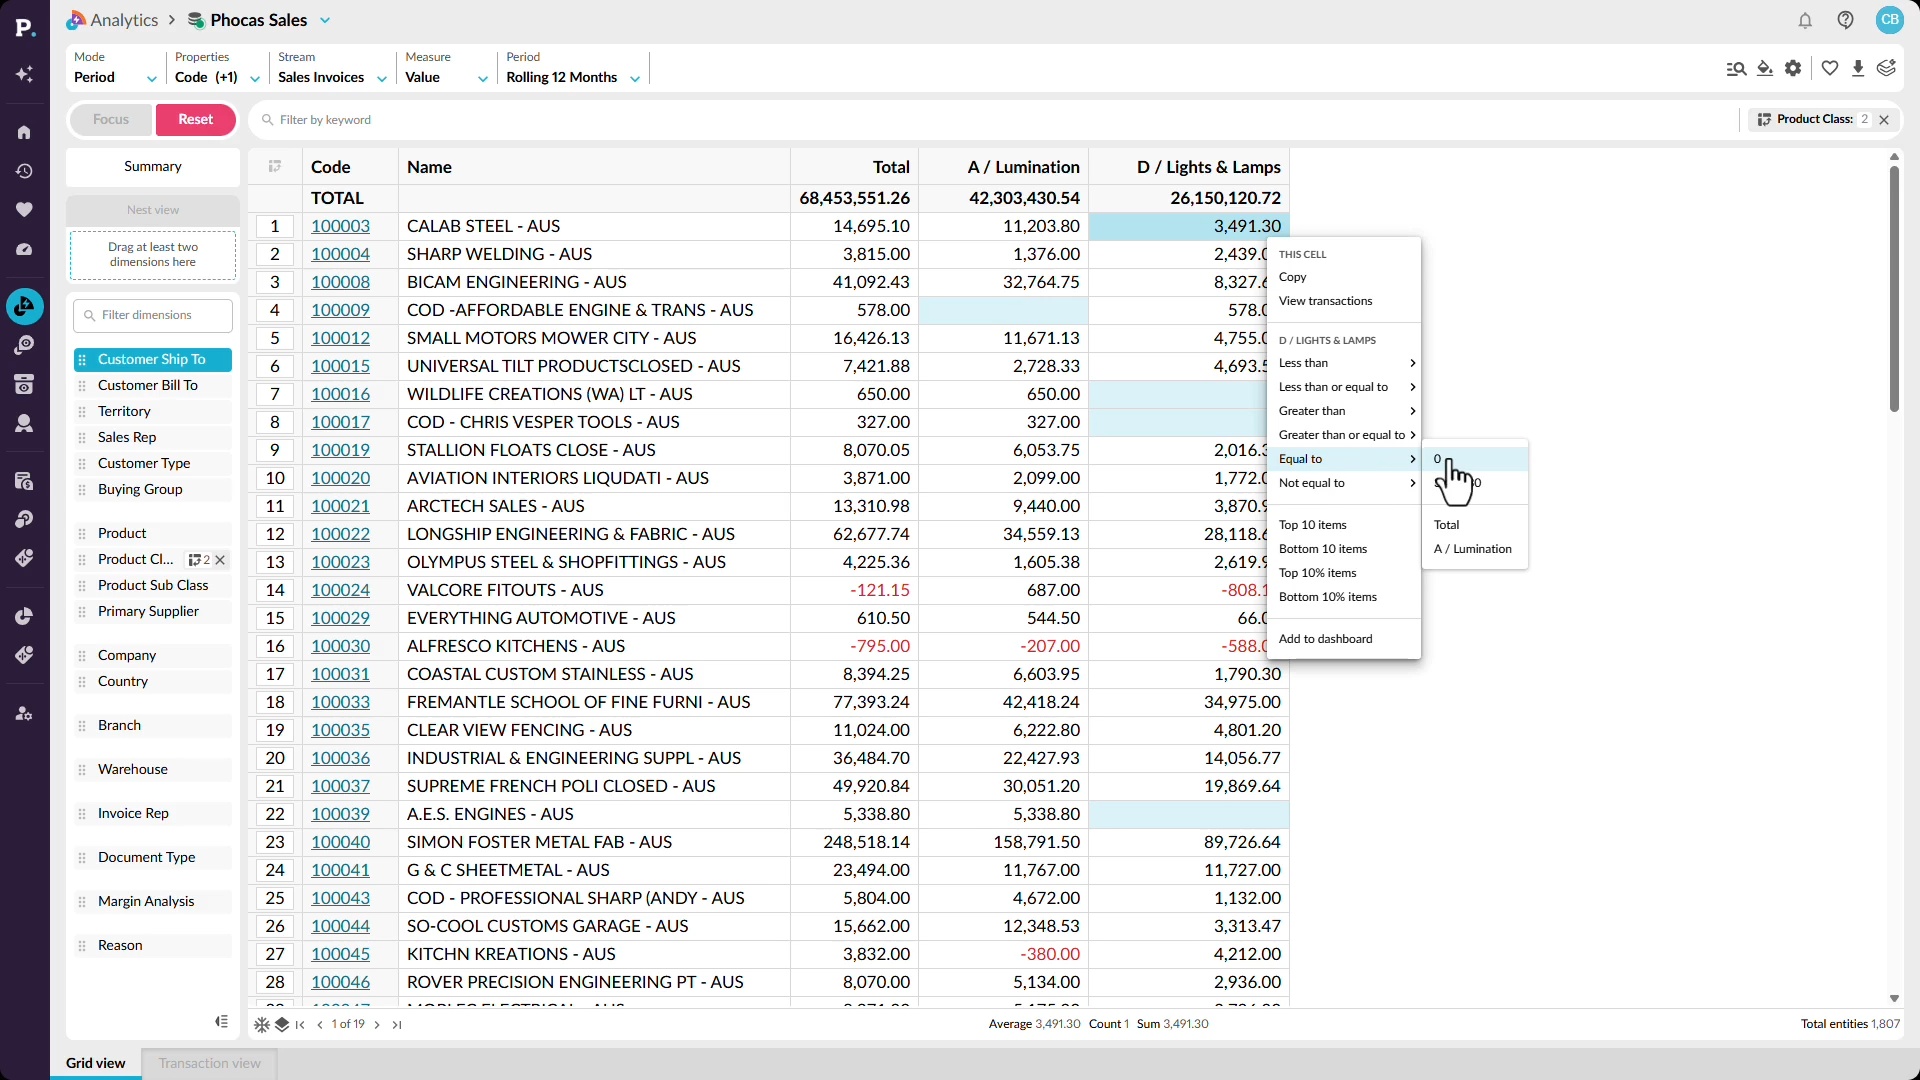
Find cross-sell opportunities by looking for gaps in what customers are buying. See how Workspaces can identify customers purchasing from one product category but not another and return a list of accounts that may have an opportunity. You can then explore the same pattern across your wider customer base and filter the data to focus on specific category combinations. This gives you a repeatable way to find accounts where related products or categories are missing from the current sales mix.
 Analytics
See churn risk across your whole patch
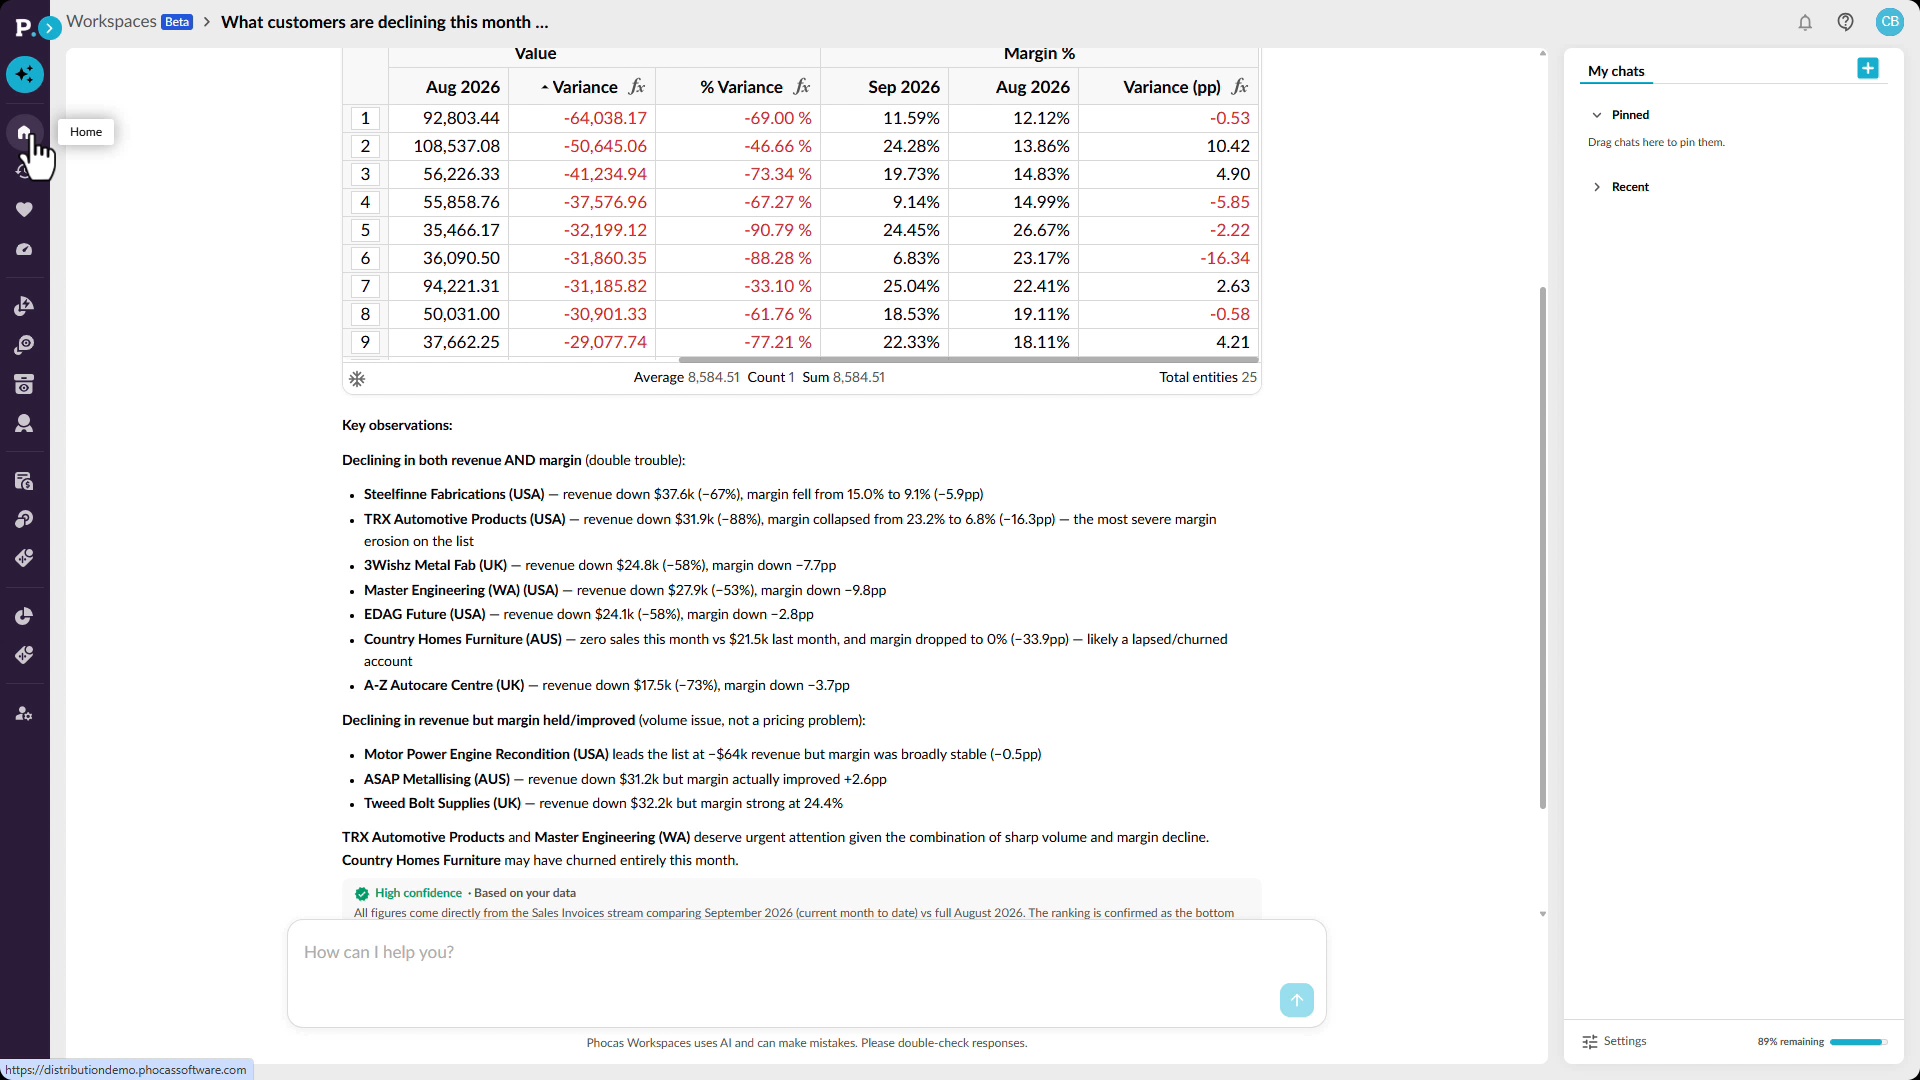
Spot customers showing signs of decline before the problem becomes more significant. See how Workspaces can use conversational AI to identify customers with falling sales or margin and surface observations that can help sales reps decide where to focus their attention. You can then examine performance across consecutive periods to find customers whose sales have been declining over several months. The resulting analysis can be saved and revisited as new data arrives, helping you keep track of changing customer behavior over time.
 Analytics
Make OTIF a number you manage
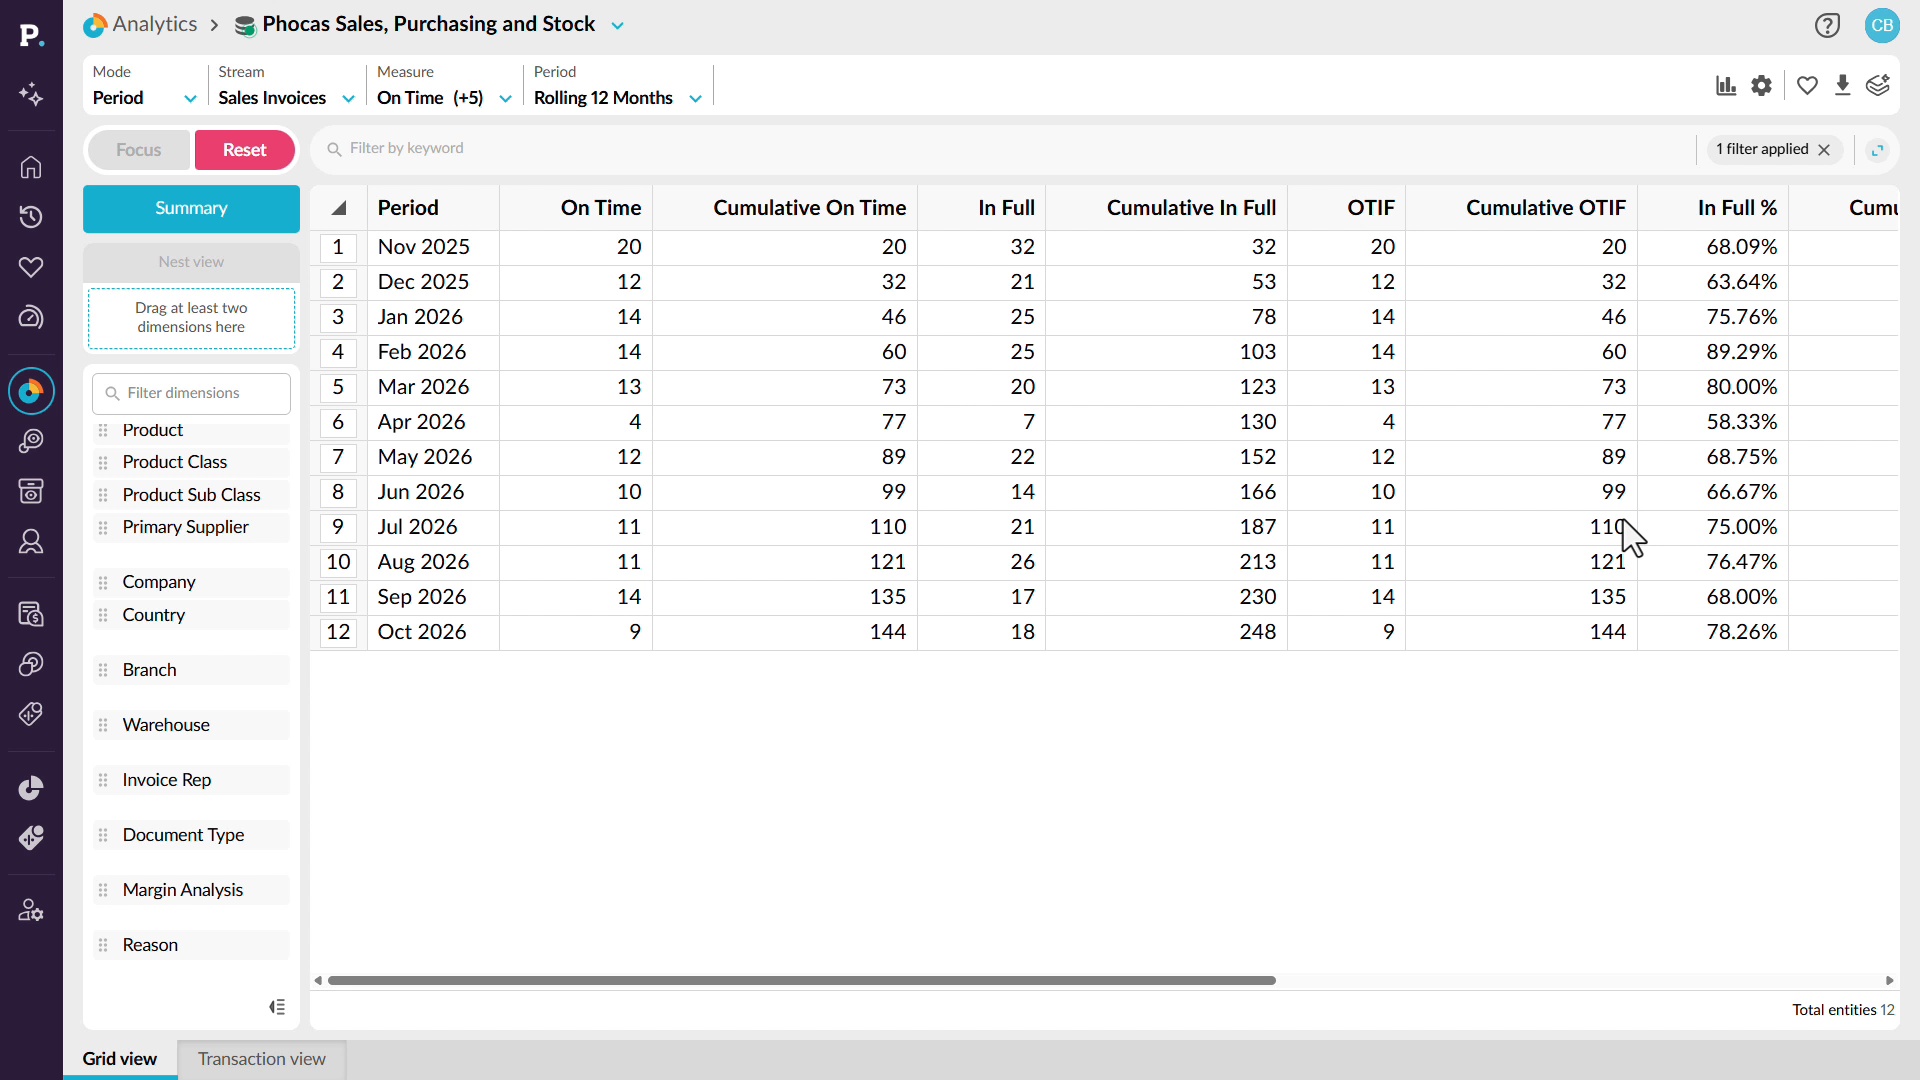
Keep track of on-time, in-full (OTIF) delivery performance so you can identify service issues before they affect customer relationships. See how to bring OTIF measures into your analysis and review performance trends across a rolling twelve-month period. You can investigate months where delivery performance falls, switch to customer-level analysis, and use filters to identify the lowest-performing customers. From there, explore product categories, individual products, and suppliers to understand what's contributing to missed delivery targets. This helps you identify recurring problems, focus on the areas that need attention, and take action to improve delivery reliability.
