Manage favorites, dashboards, and subscriptions

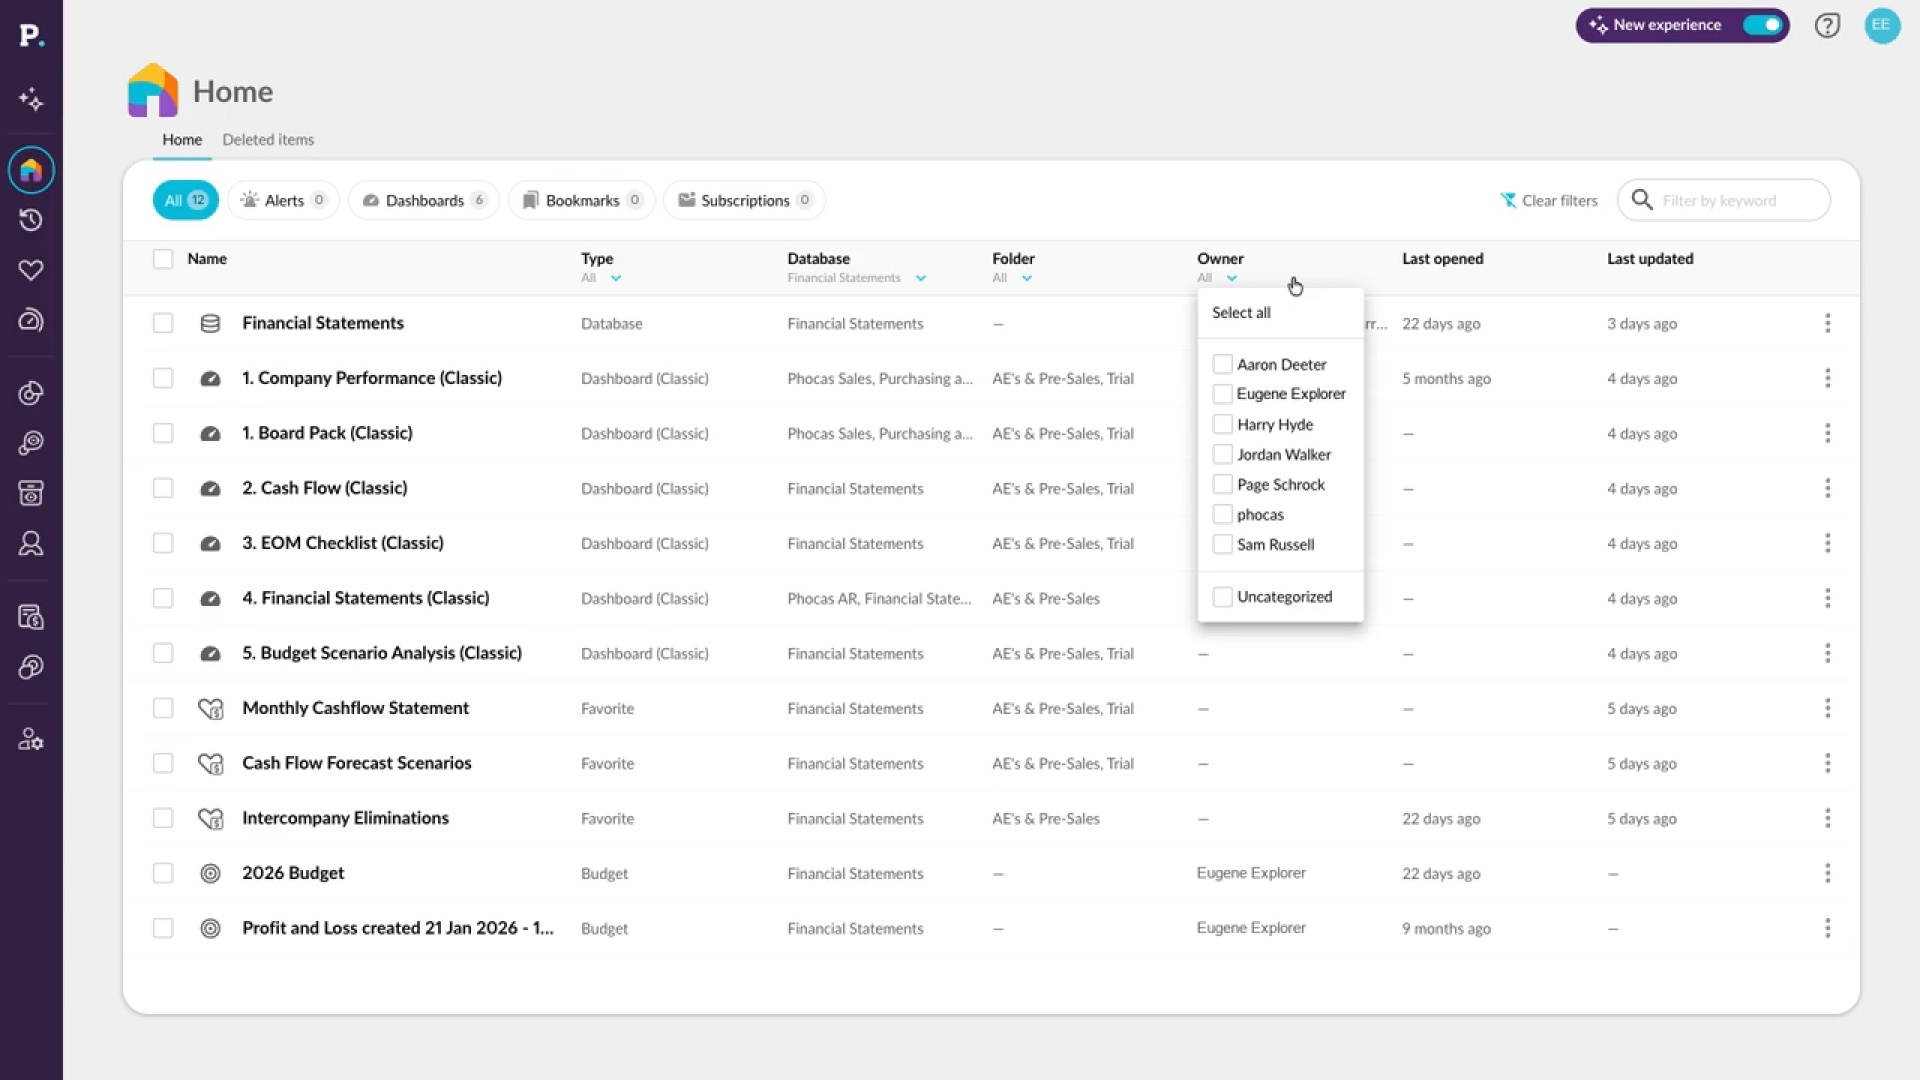
Learn how to filter the favorites list by database, owner, or folder, then share a favorite with a folder and with individual users who have access to its data. You also learn how to subscribe a user to email notifications that arrive when data changes, and how the Dashboards screen lets you share, subscribe, or delete dashboards the same way.
Supporting documentation


Related video tutorials
 Analytics
Homepage at a glance
Learn how to find your way around the homepage, from the All, Alerts, Dashboards, Bookmarks, and Subscriptions tabs to search, filters, and sorting. You'll also see how to share, bookmark, or edit items from the row menu and restore deleted items within 45 days.
 Platform
Manage folders
Learn how to create a folder in Administration, name it, choose who has access, and decide whether they can post to it, noting that profile settings still determine posting permission. You can see how many users each folder is shared with and how many favorites and dashboards have been shared through it, and rename it, change access, or delete it. Deleting is permanent.
 Analytics (Classic)
Create an interactive dashboard
Learn how to set up a dashboard with a name and owner and decide how it's shared, then add content as widgets. You'll add one from a favorite, build another directly in the dashboard as a donut chart of sales by brand, and make it filterable so you can focus on specific data and reset back to the overview.
 Dashboards
Add a widget to a dashboard
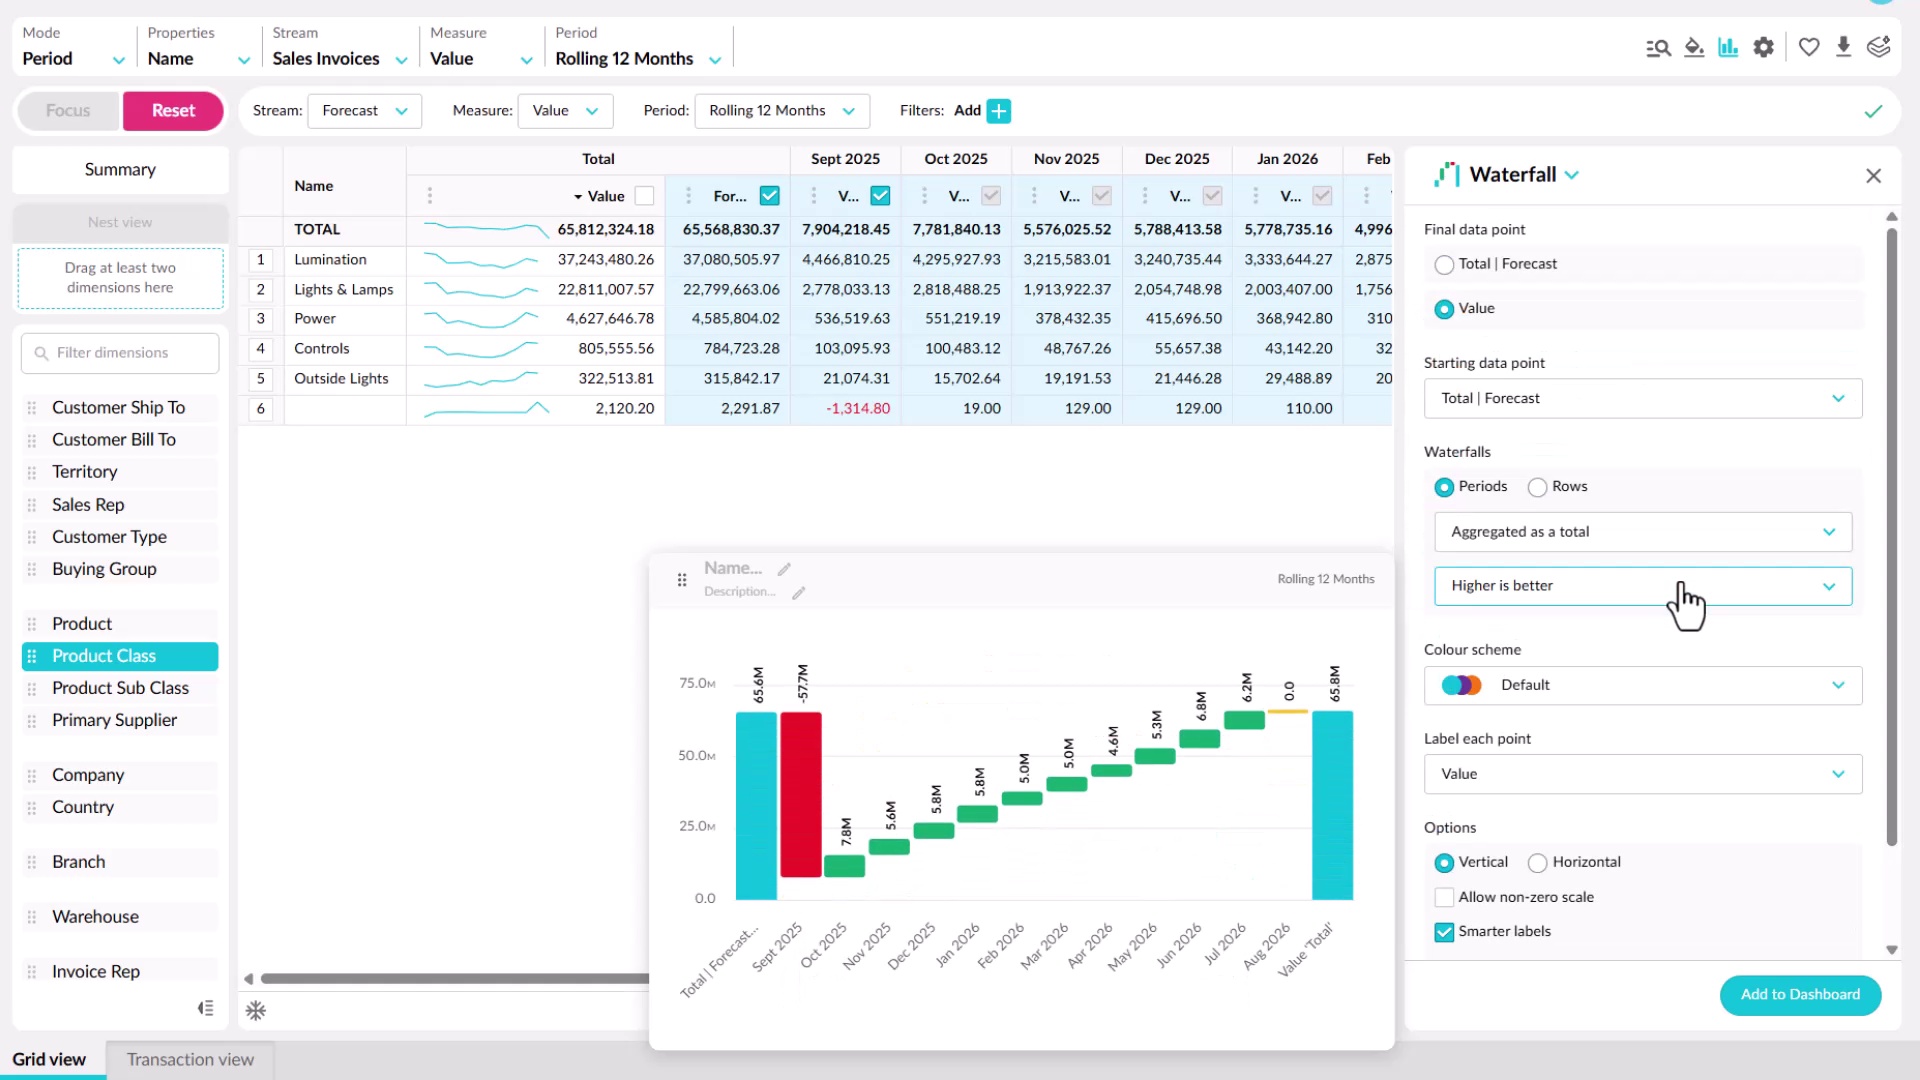
Learn how to add a widget from a dashboard or from Analytics or Financial Statements. You'll choose a chart type for what you want to show, such as bar, line, pie, value card, gauge, or waterfall, set options like colors and whether it responds to filters, then name it and add it to an existing or new dashboard.
