Video tutorials
 Analytics
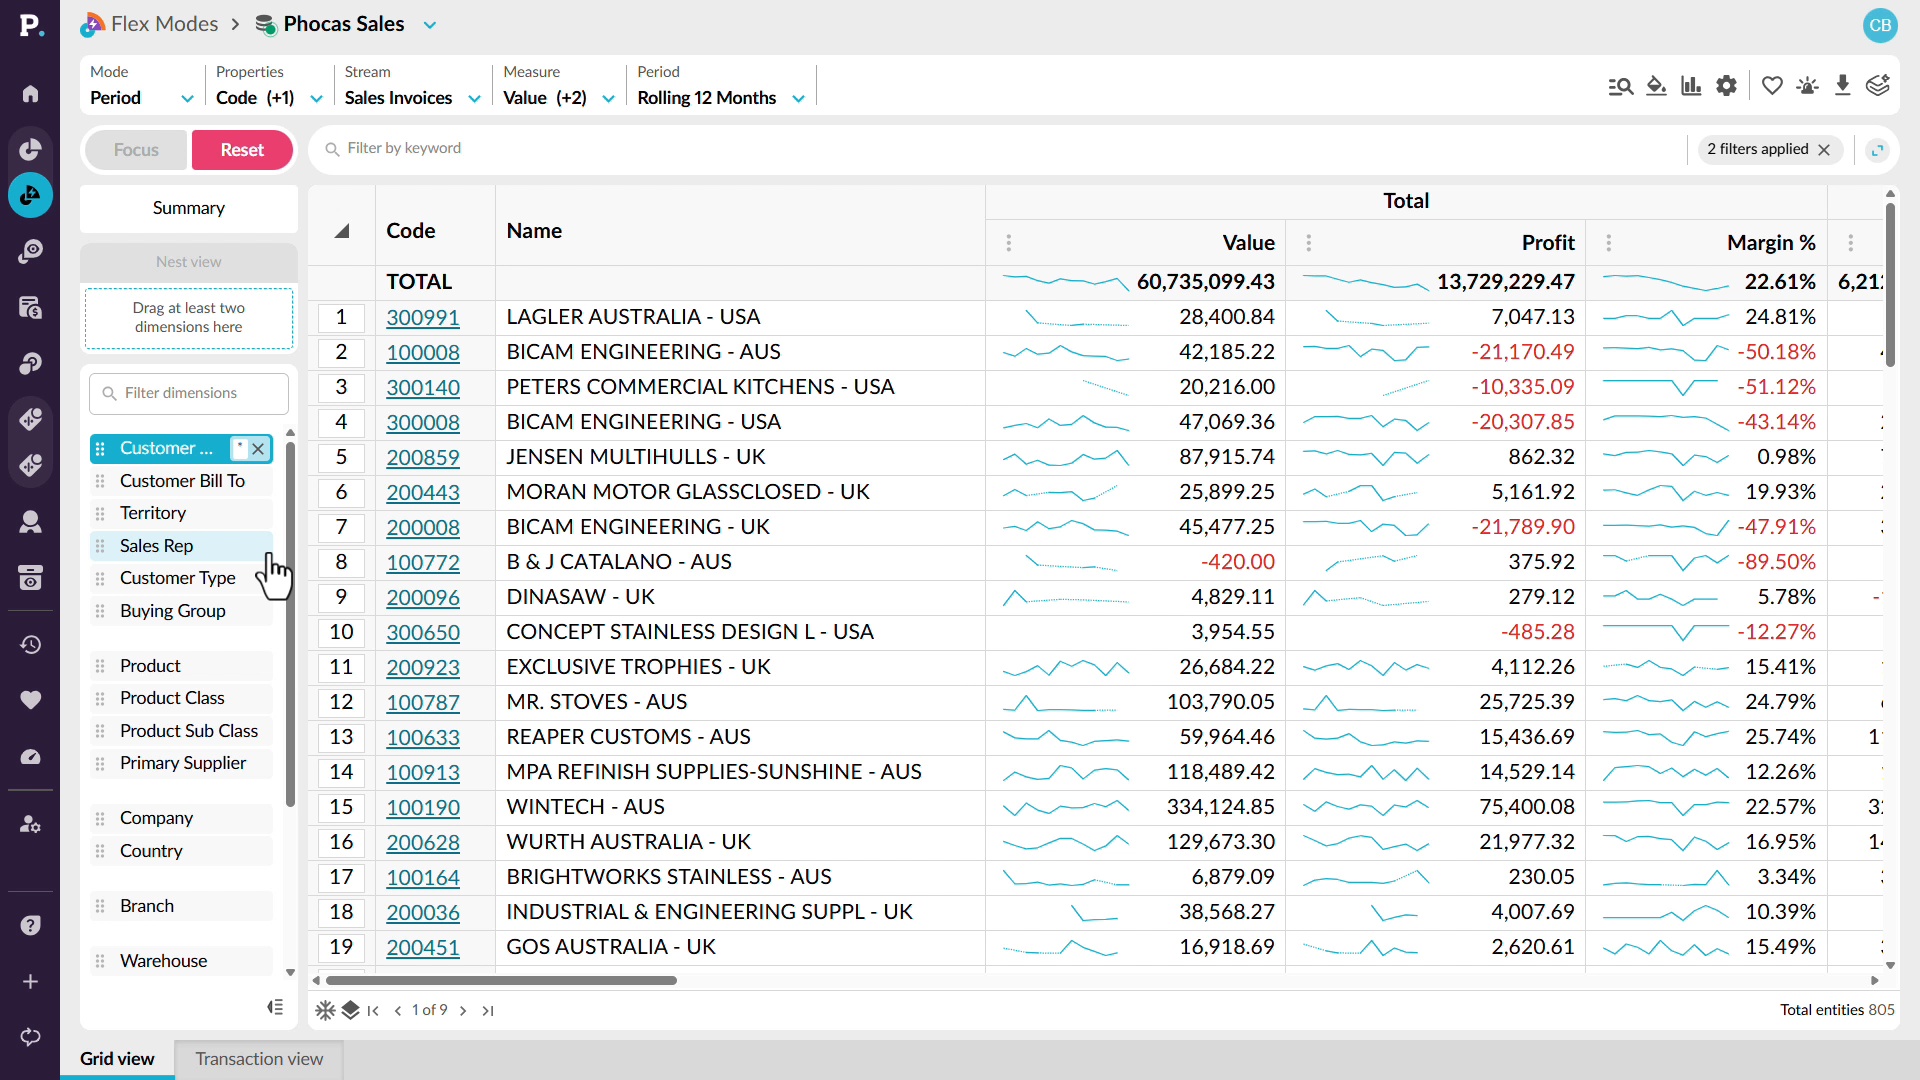
See margin next to every sale
Look beyond sales revenue to understand the profitability behind your results. See how to add profit and margin alongside sales so you can compare revenue and profitability in the same analysis. You can identify periods where margin is falling, move into customer-level detail, and sort the results to find the accounts contributing most to the change. From there, drill into the underlying transactions to identify low-margin or unprofitable sales and review the discounts or individual transactions behind them.
 Analytics
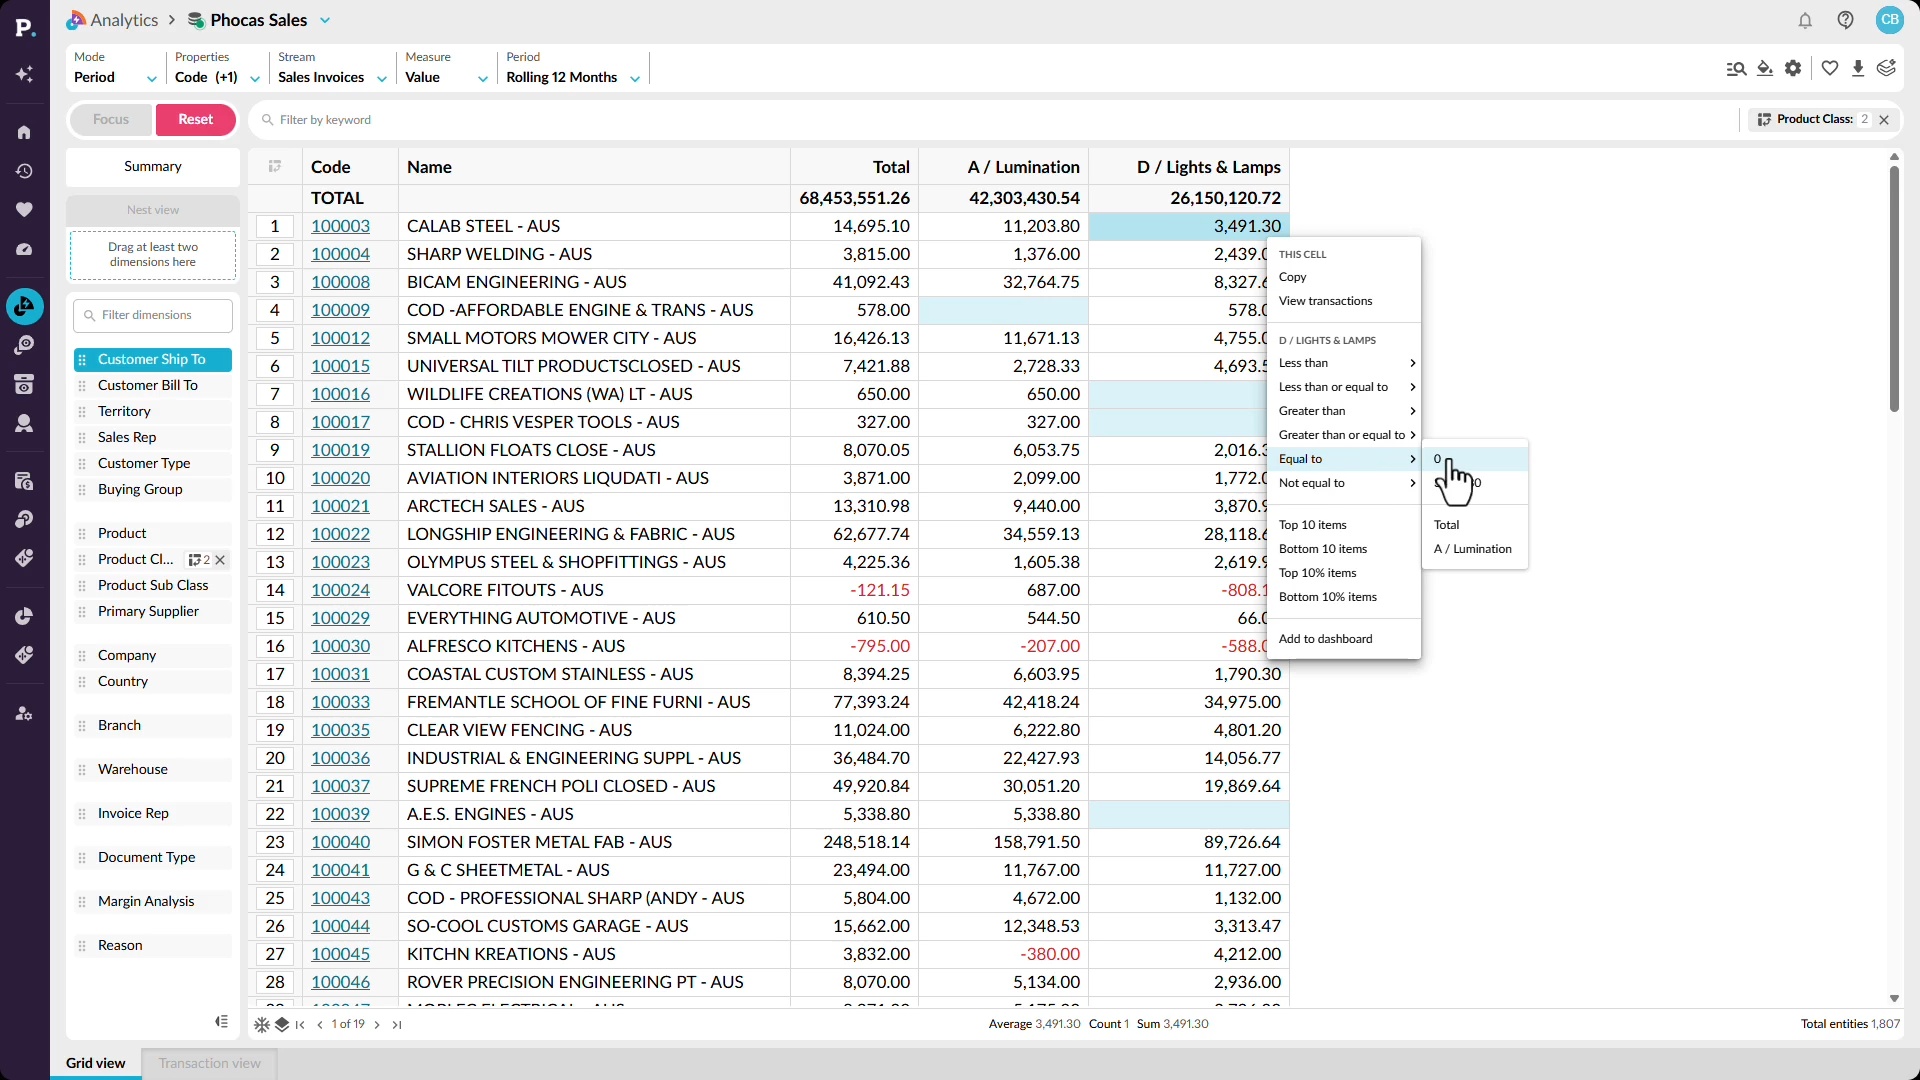
See cross-sell gaps across every account
Find cross-sell opportunities by looking for gaps in what customers are buying. See how Workspaces can identify customers purchasing from one product category but not another and return a list of accounts that may have an opportunity. You can then explore the same pattern across your wider customer base and filter the data to focus on specific category combinations. This gives you a repeatable way to find accounts where related products or categories are missing from the current sales mix.
 Analytics
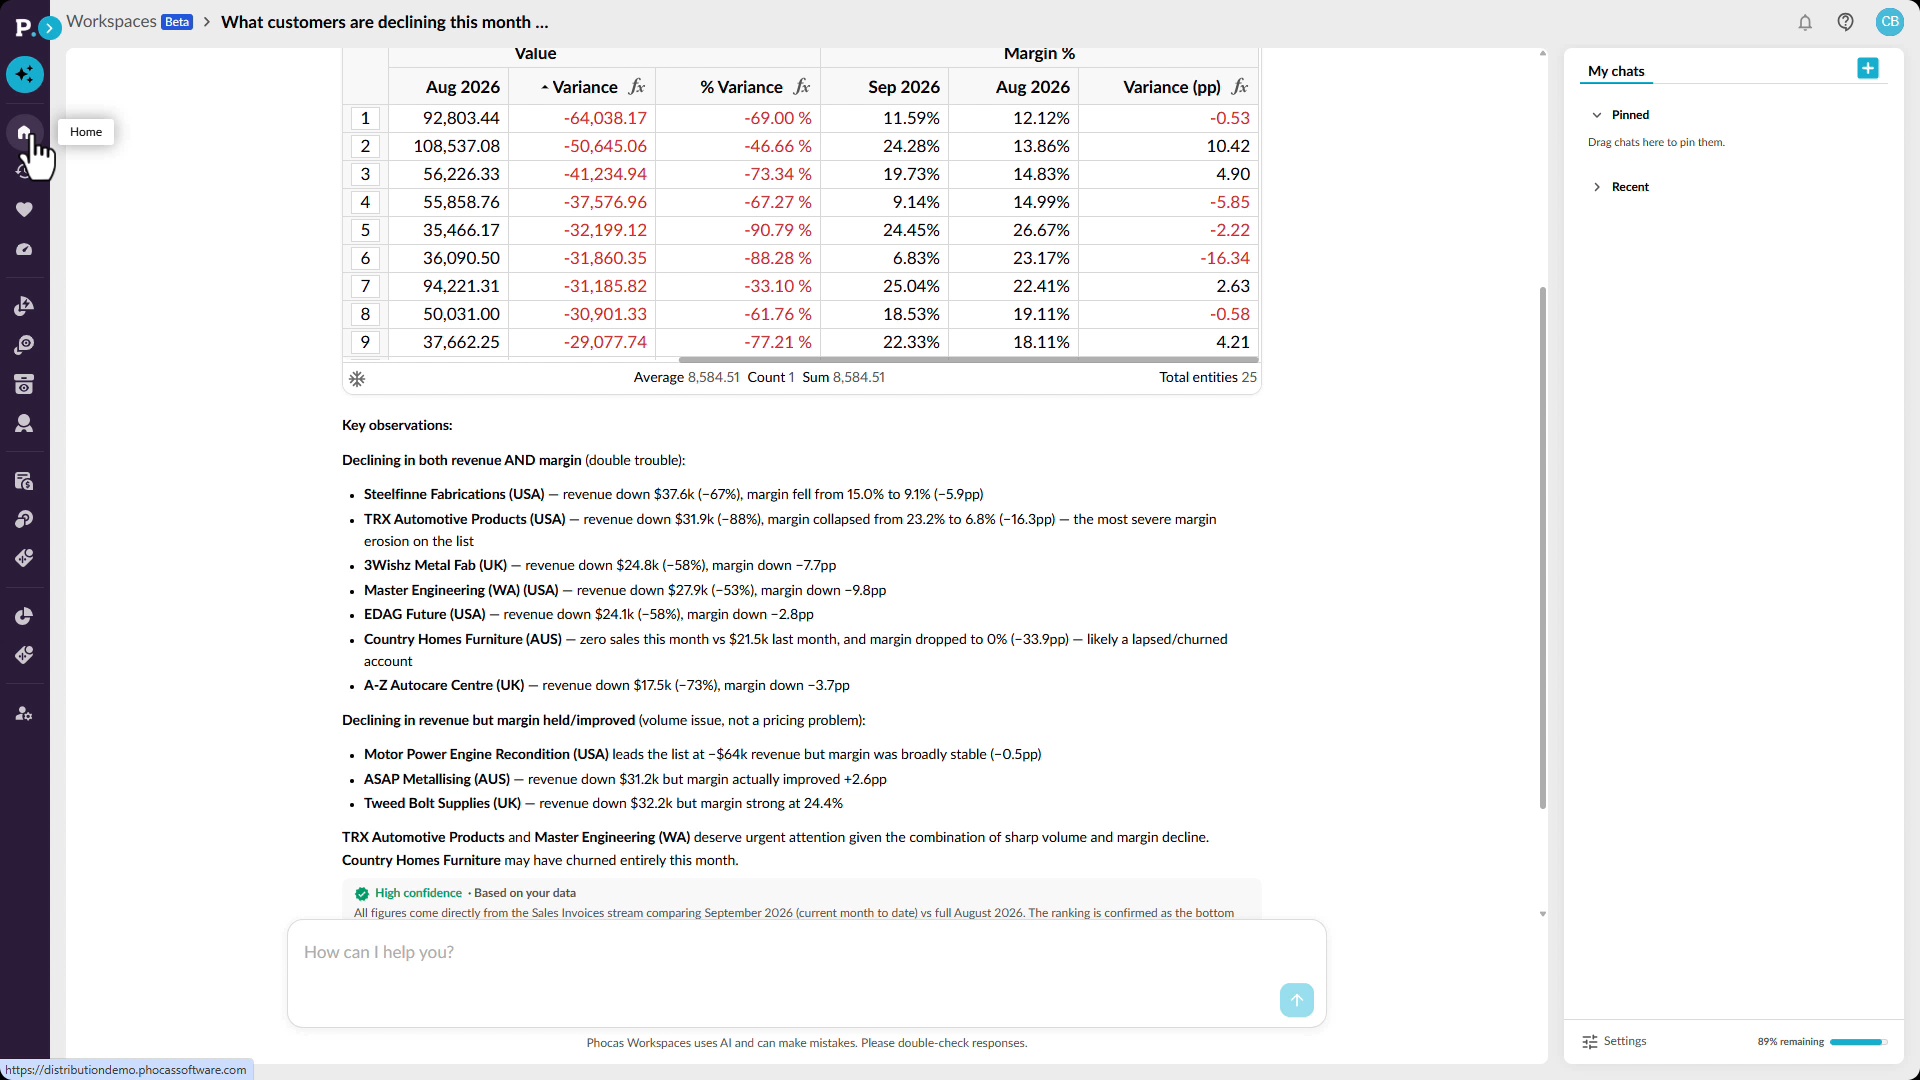
See churn risk across your whole patch
Spot customers showing signs of decline before the problem becomes more significant. See how Workspaces can use conversational AI to identify customers with falling sales or margin and surface observations that can help sales reps decide where to focus their attention. You can then examine performance across consecutive periods to find customers whose sales have been declining over several months. The resulting analysis can be saved and revisited as new data arrives, helping you keep track of changing customer behavior over time.
 Workspaces
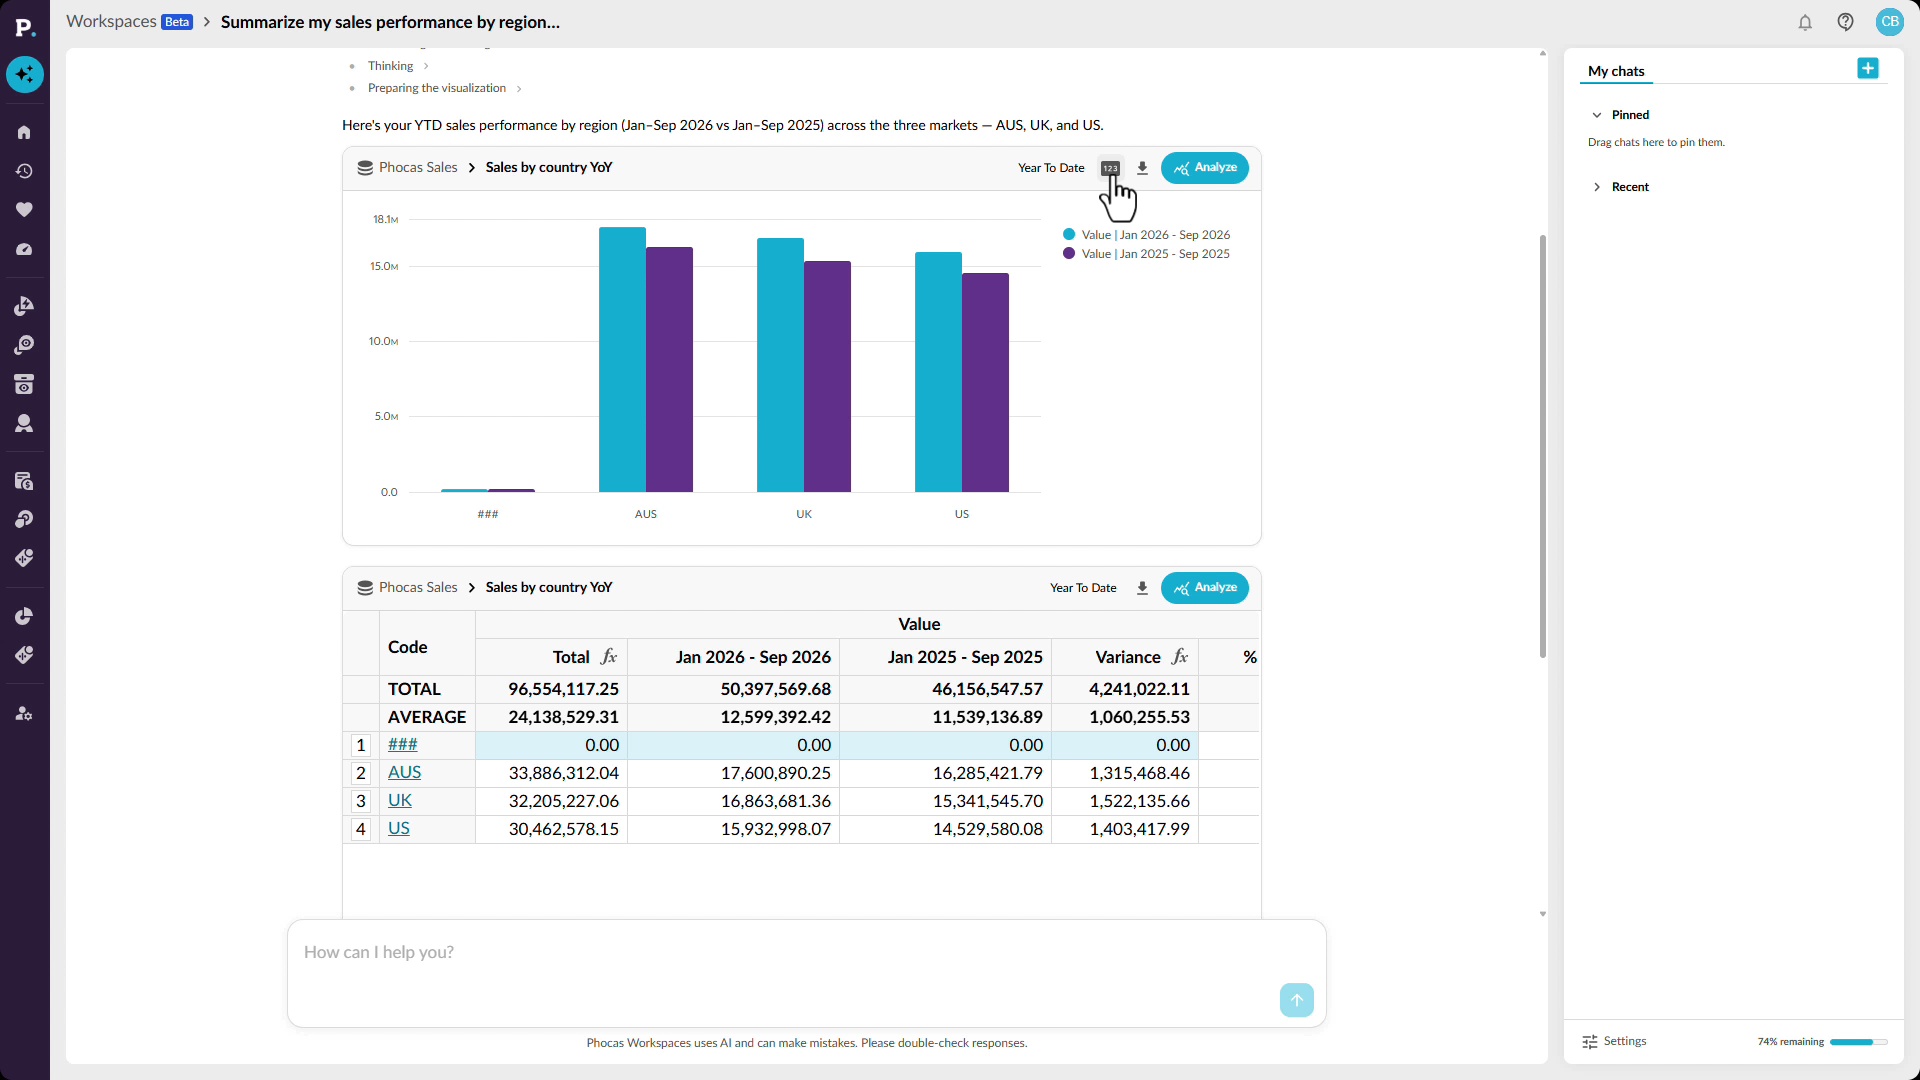
Get your own answer in seconds
Ask questions about your data in plain language and get answers directly in Workspaces. See how conversational AI can return a chart or grid, highlight relevant figures, and provide observations that help explain the result. You can continue the analysis by asking follow-up questions or opening the result for a closer look. When you have what you need, you can save it as a favorite, add it to a dashboard, or export it to share with your team.
 Analytics
Catch an off-track rep in time
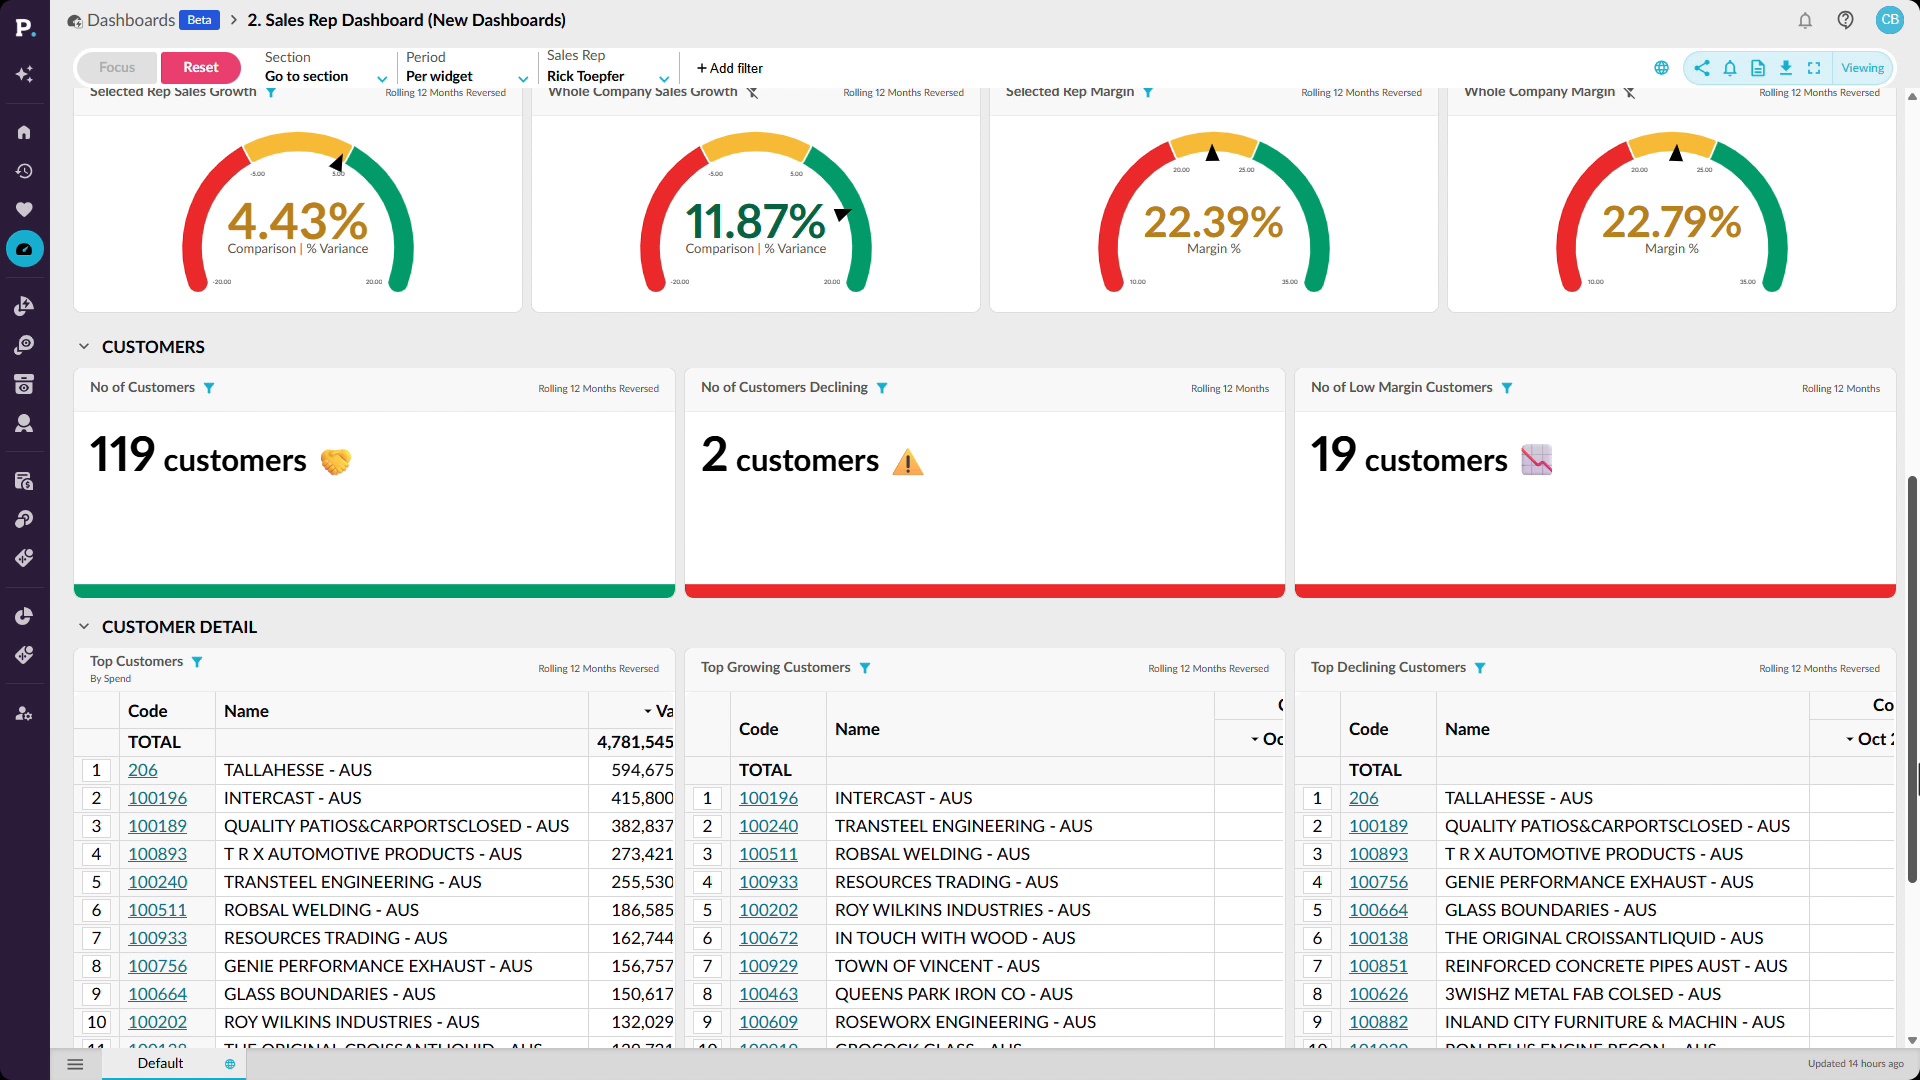
Use dashboards and detailed analysis to see how sales reps are performing against budget or quota. Start with a high-level view of performance, then filter the dashboard for an individual rep and change the reporting period to compare sales with budget year to date. From there, you can investigate where performance is falling behind and save, share, or add the results to a dashboard. This makes it easier to spot issues early and focus attention on the reps who may need support.
 Analytics
Stop losing stock to silence
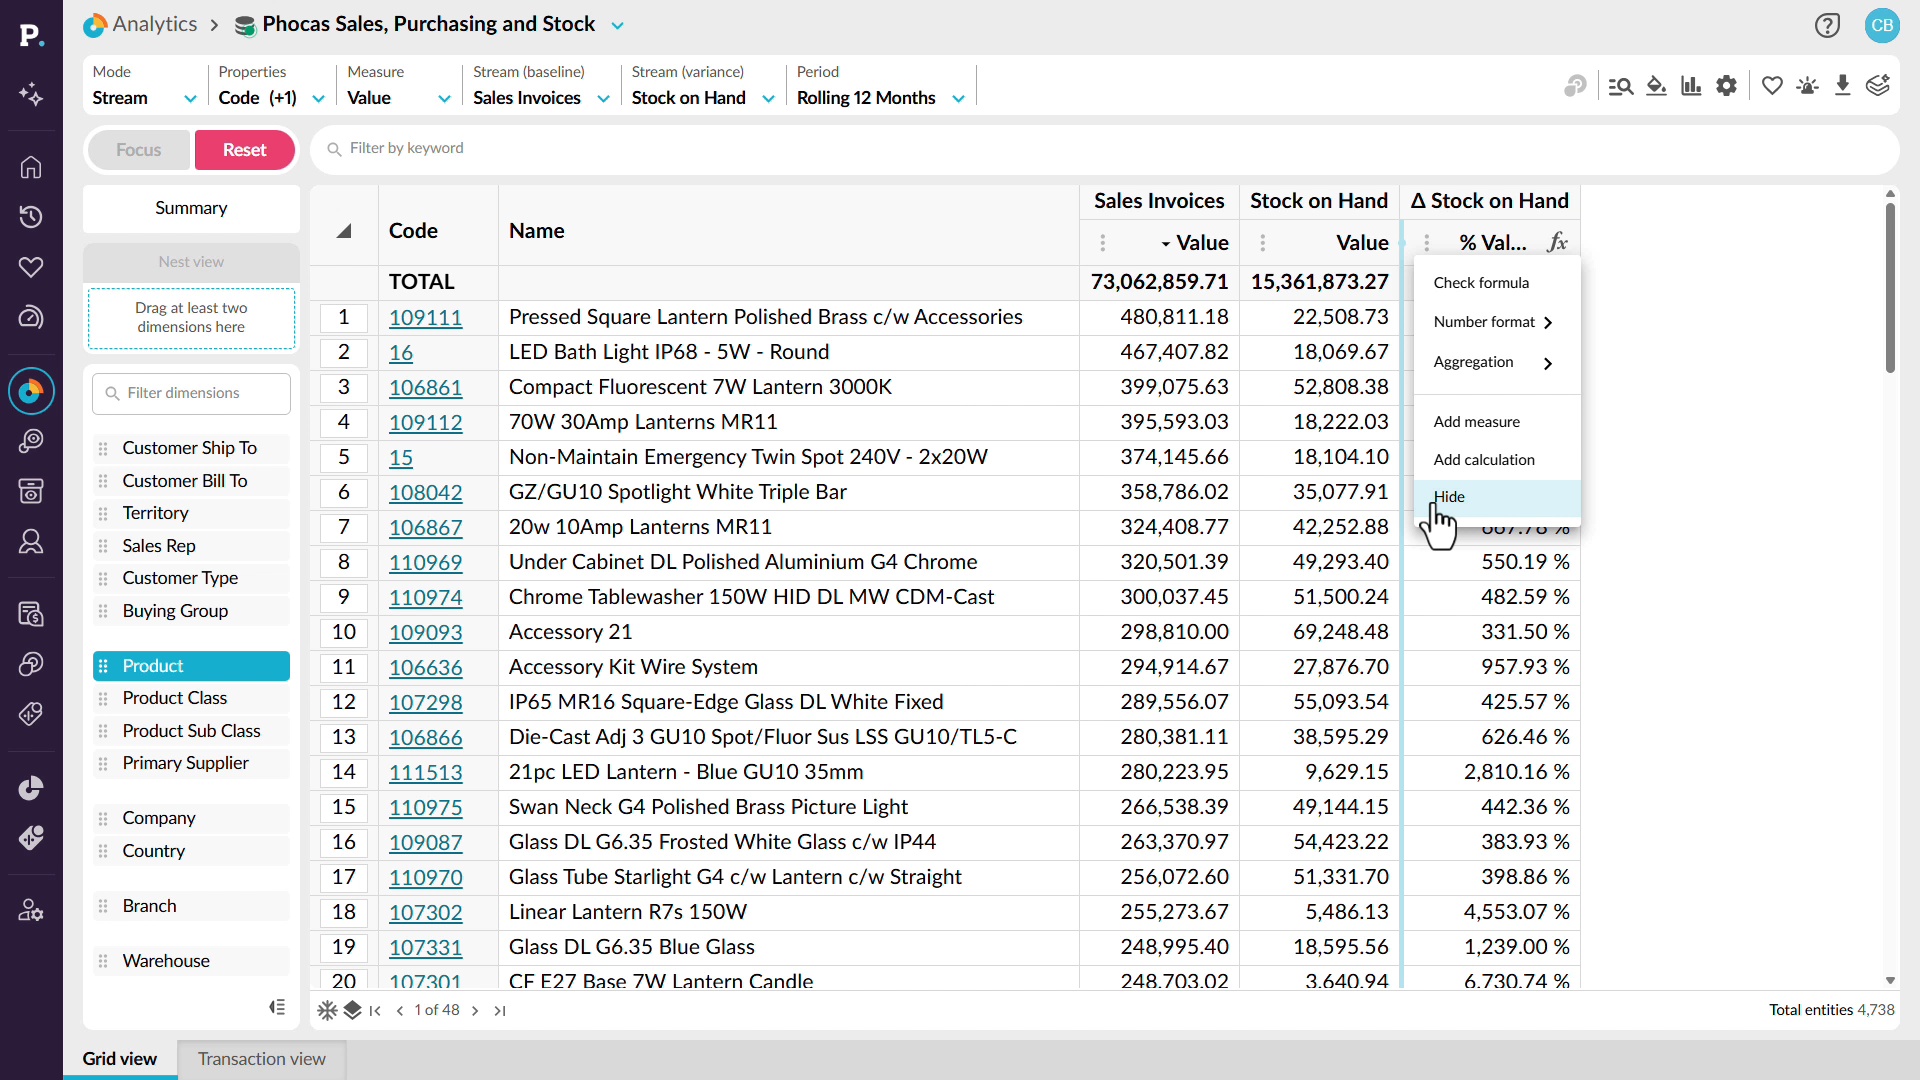
Identify dead stock and slow-moving inventory before it ties up more cash and warehouse space. See how to combine sales and stock information in the same analysis, then filter for products with no sales activity but stock still on hand. You can sort the results to find your biggest inventory concerns and save the analysis as a favorite, add it to a dashboard, or create an alert. You'll also see how to build custom inventory calculations using sales and stock measures, then compare results across different reporting periods. This gives you a clearer picture of stock movement and helps you make informed purchasing and inventory decisions.
 Analytics
Walk into the negotiation with receipts
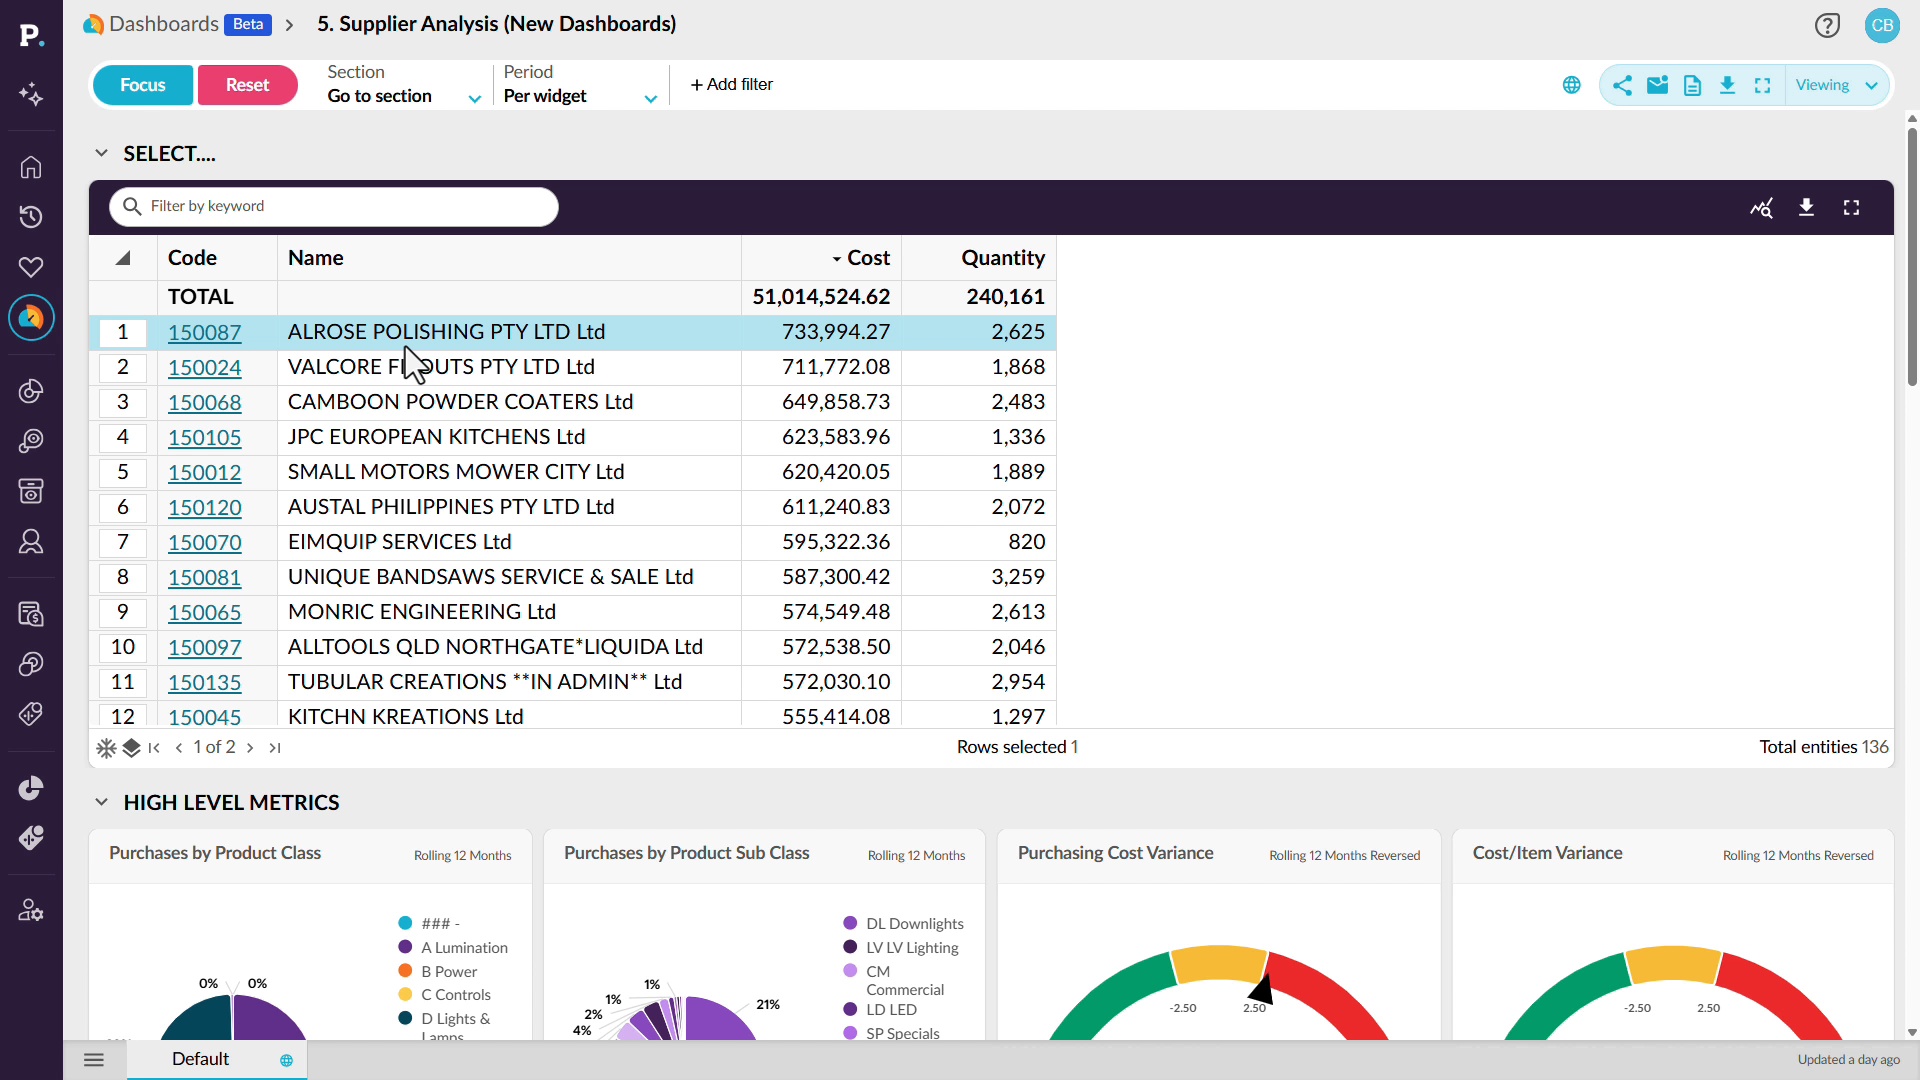
Prepare for supplier negotiations with a clear picture of purchasing activity, costs, and supplier performance. See how a supplier analysis dashboard brings together information such as purchasing costs, quantities, open purchase orders, average order values, and potential price changes. You can filter the dashboard for a particular supplier or product category to review the figures that matter to your discussion. From there, move into detailed analysis to investigate purchasing cost variances, compare trends over time, and drill down to individual purchase order transactions. This gives you the evidence to understand spending patterns, question price changes, and approach supplier conversations with data to support your decisions.
 Analytics
Make OTIF a number you manage
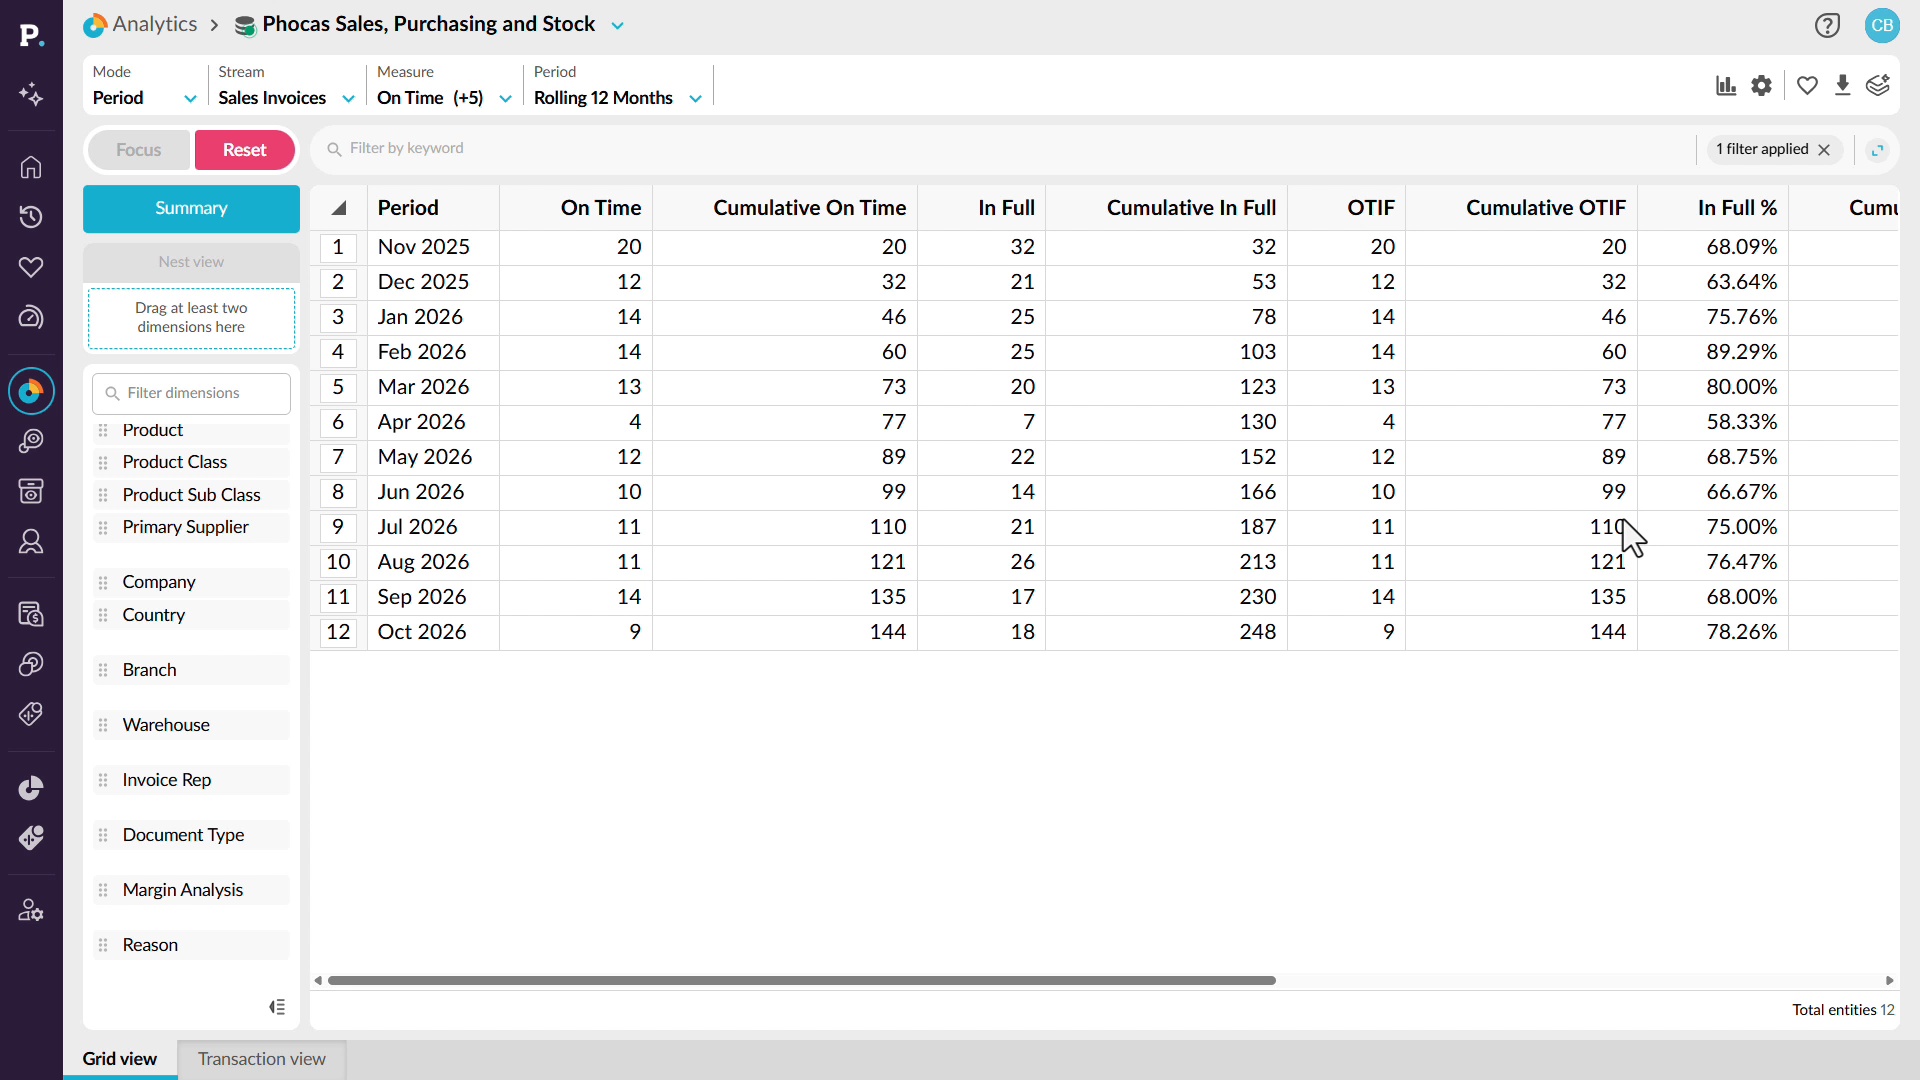
Keep track of on-time, in-full (OTIF) delivery performance so you can identify service issues before they affect customer relationships. See how to bring OTIF measures into your analysis and review performance trends across a rolling twelve-month period. You can investigate months where delivery performance falls, switch to customer-level analysis, and use filters to identify the lowest-performing customers. From there, explore product categories, individual products, and suppliers to understand what's contributing to missed delivery targets. This helps you identify recurring problems, focus on the areas that need attention, and take action to improve delivery reliability.
 Analytics
Explain the variance, don't just log it
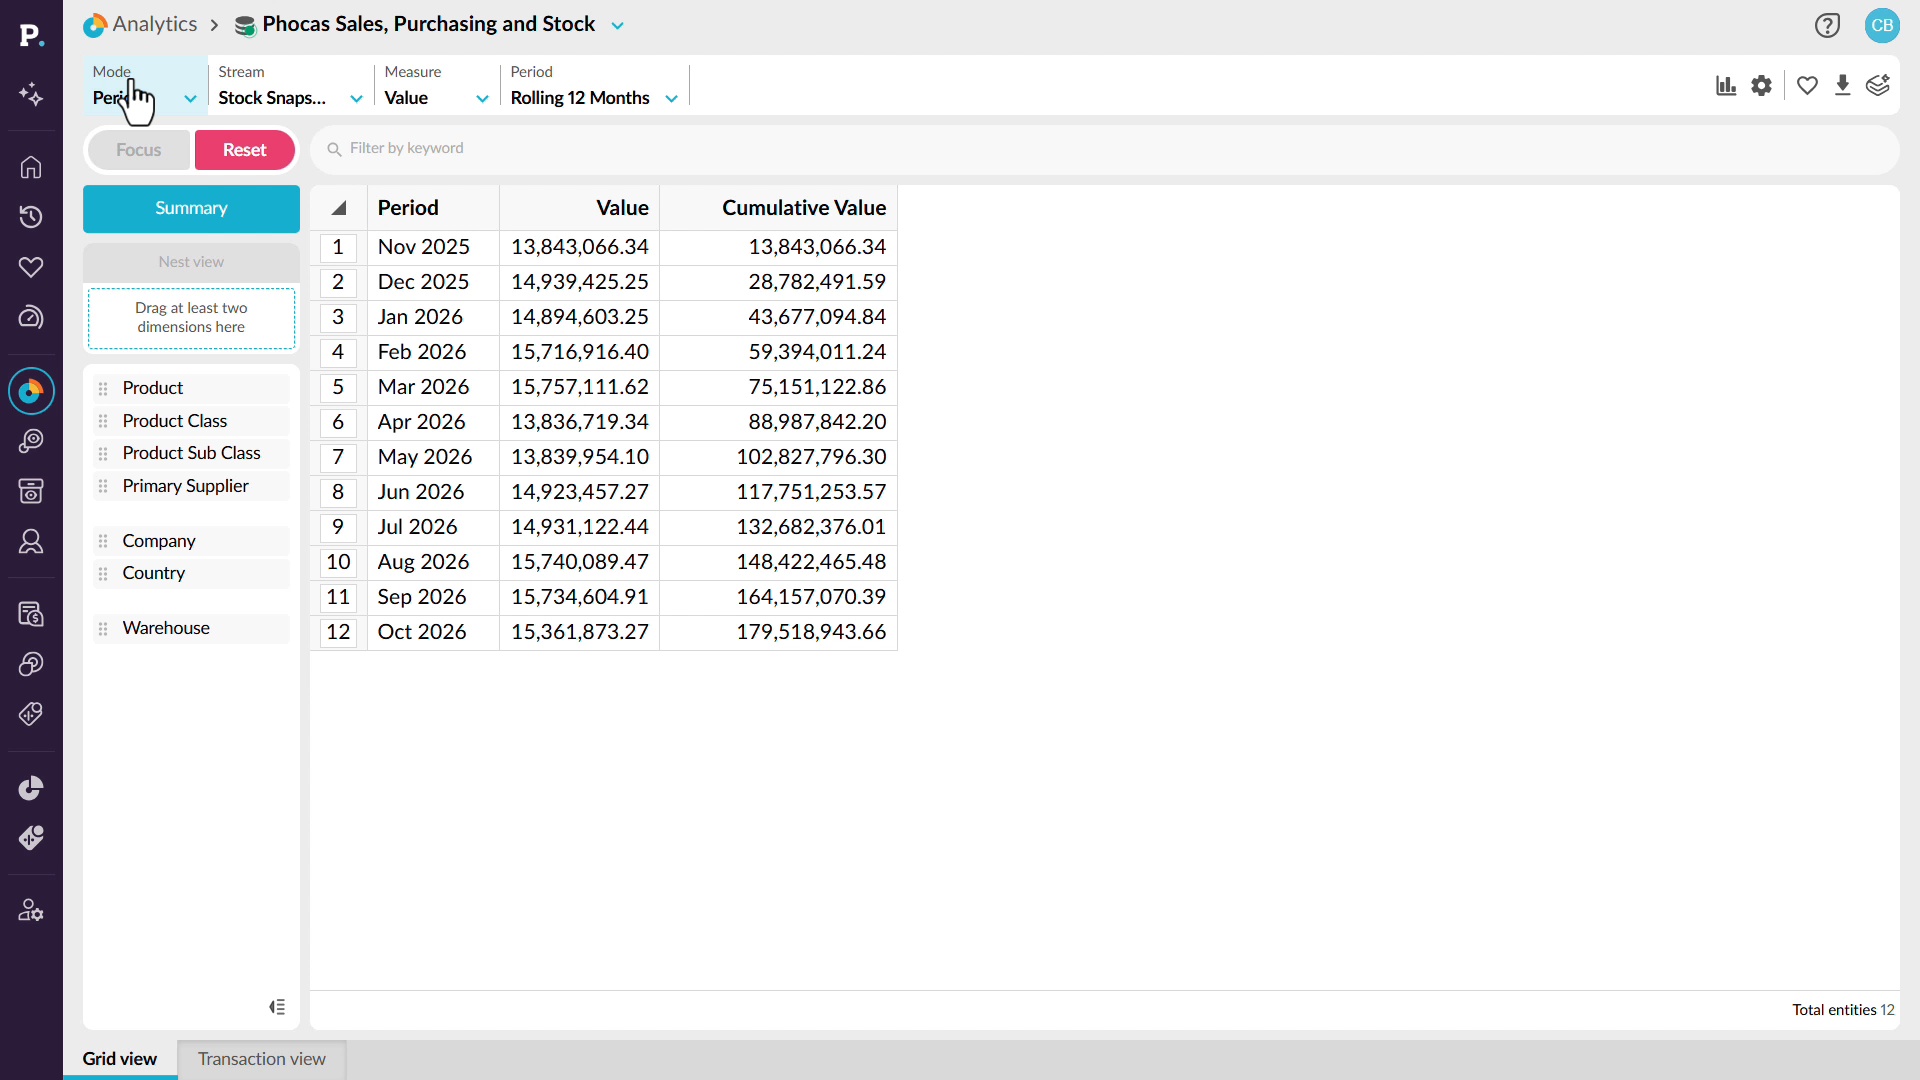
Get to the bottom of inventory discrepancies instead of repeatedly writing off unexplained variances. See how to use stock snapshots and historical inventory data to investigate changes over a rolling twelve-month period. By switching between data streams, variance analysis, and product dimensions, you can identify where the largest differences occur and drill into the underlying detail. Depending on the data available, you can investigate discrepancies by product, warehouse location, bin, or user. This helps you uncover patterns behind stock variances, understand potential causes of shrinkage, and address recurring inventory issues before they continue costing your business money.
 Analytics
Know your weeks of cover
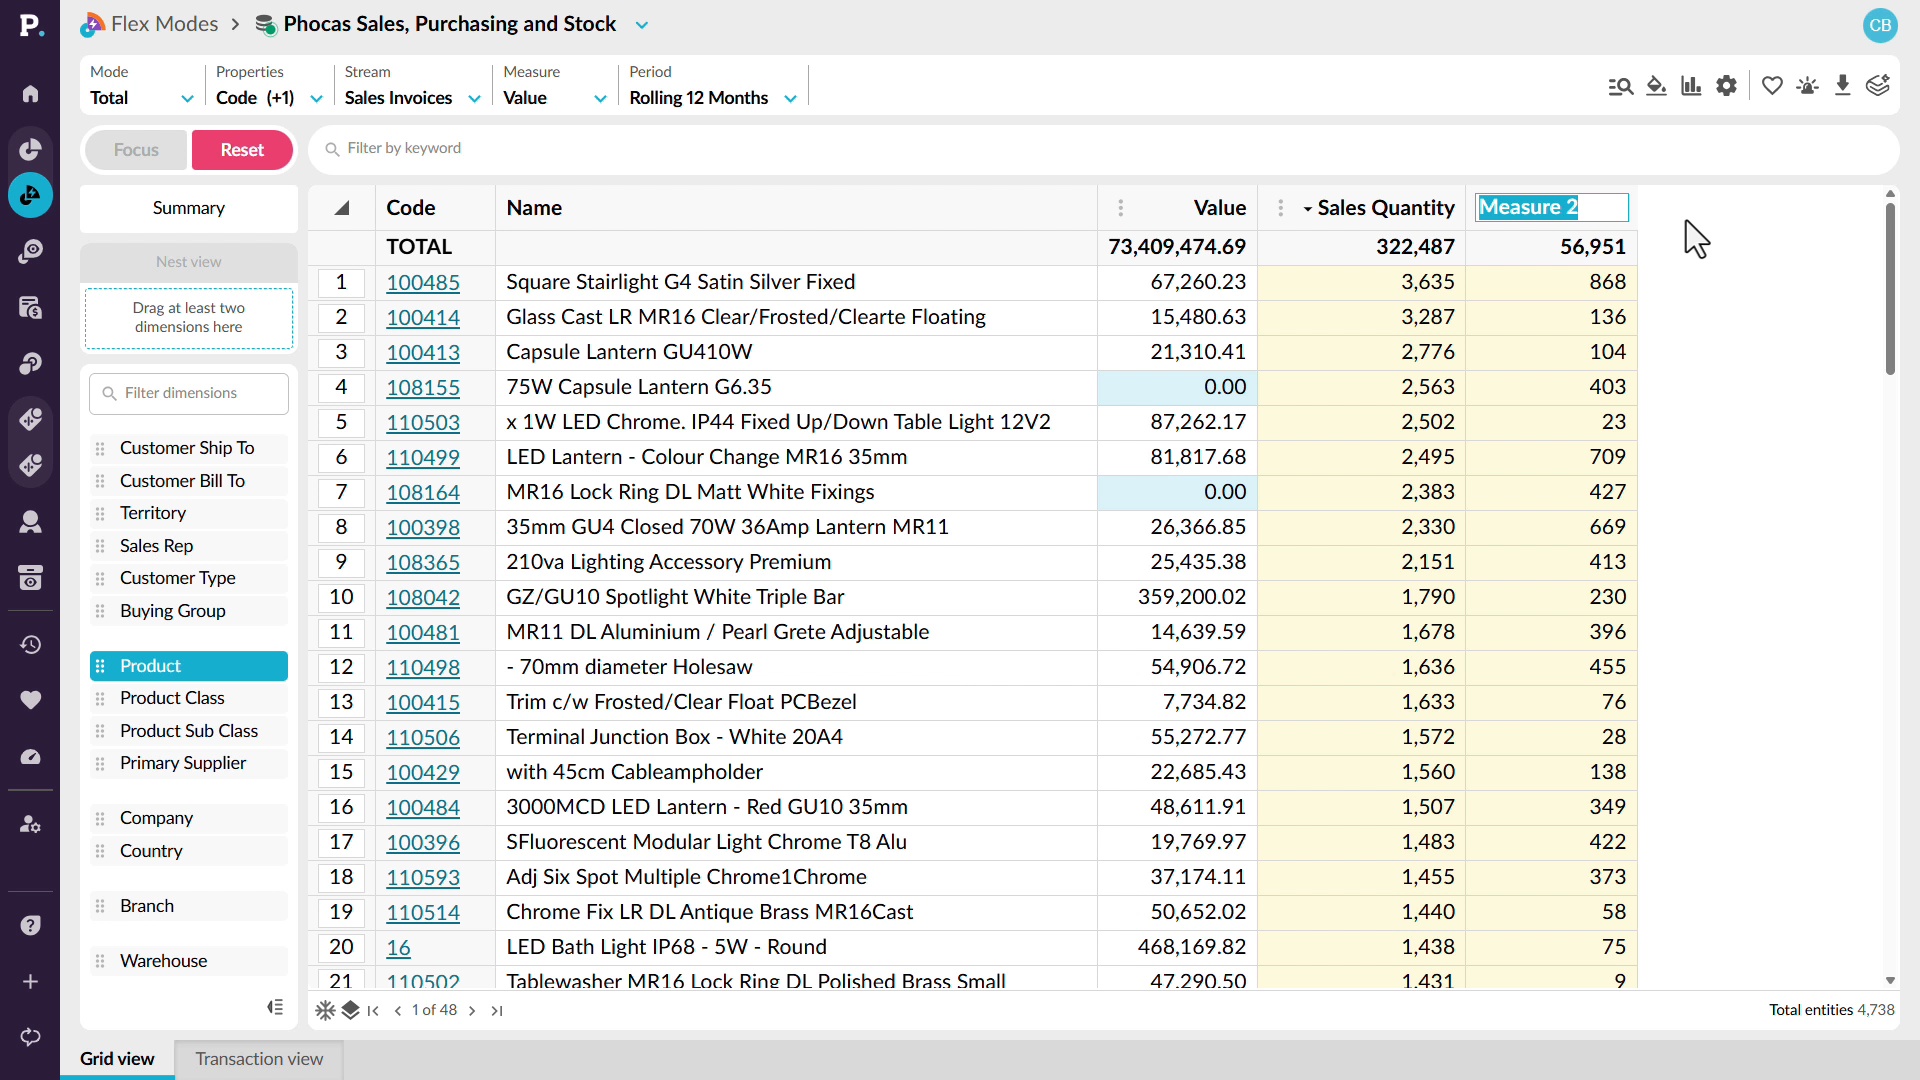
Bring sales, purchasing, and stock information together to get a clearer view of your inventory position. See how to add measures such as sales quantity and stock on hand, then use those values to create calculations directly in the grid. You’ll also see how to build measures such as weeks of cover and stock turnover, and adapt the calculations for different reporting periods. Because the results use the data already in your analysis, they update as new ERP data becomes available.
 Analytics
Walk in already briefed
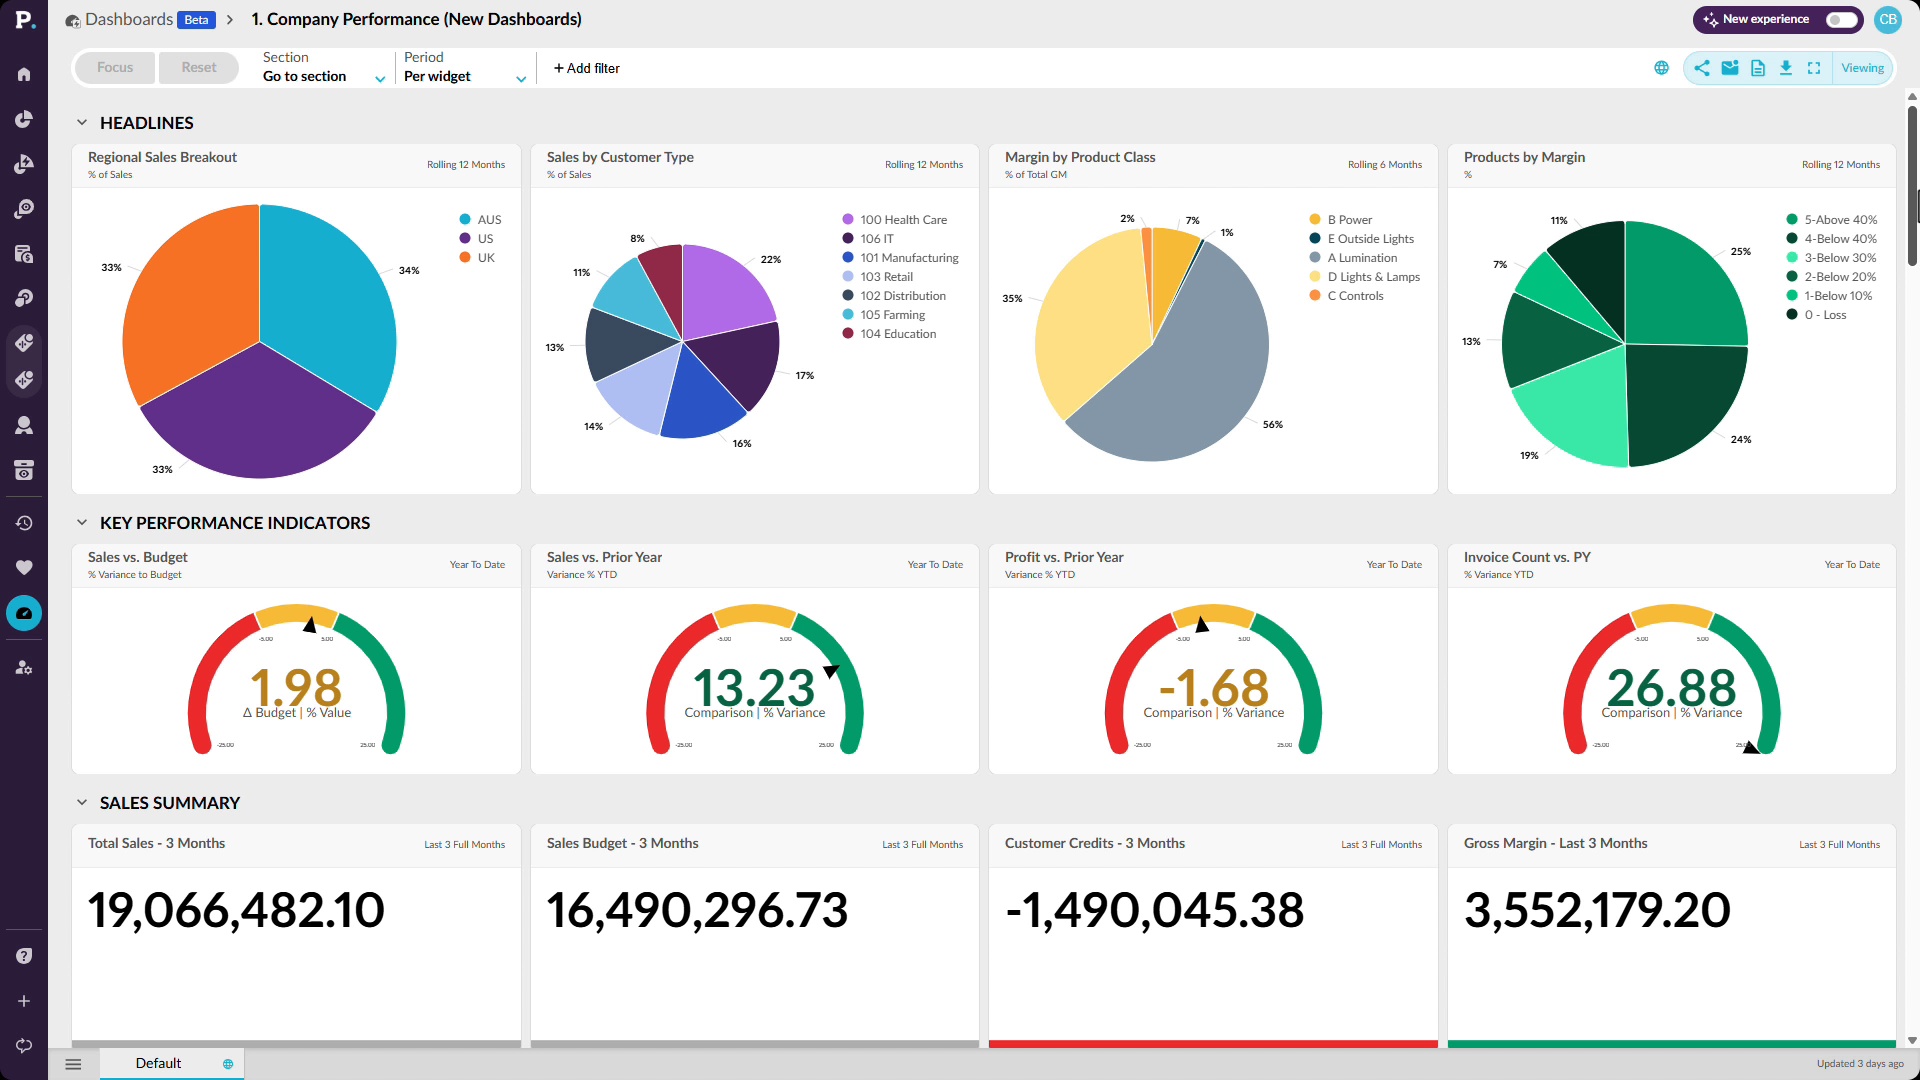
Get ready for reviews without spending hours chasing numbers, waiting on reports, or piecing information together. See how a dashboard brings KPIs from across the business into one place, including sales to budget, profitability, customer credits, quote conversion, rep performance, inventory, and finance. You’ll also see how to focus the entire dashboard on a region, add filters such as product class, and drill into the data behind a result when something needs more attention. This gives you a faster way to answer your own questions and walk into a meeting with the detail already at hand.
 Analytics
Stop waiting on an answer
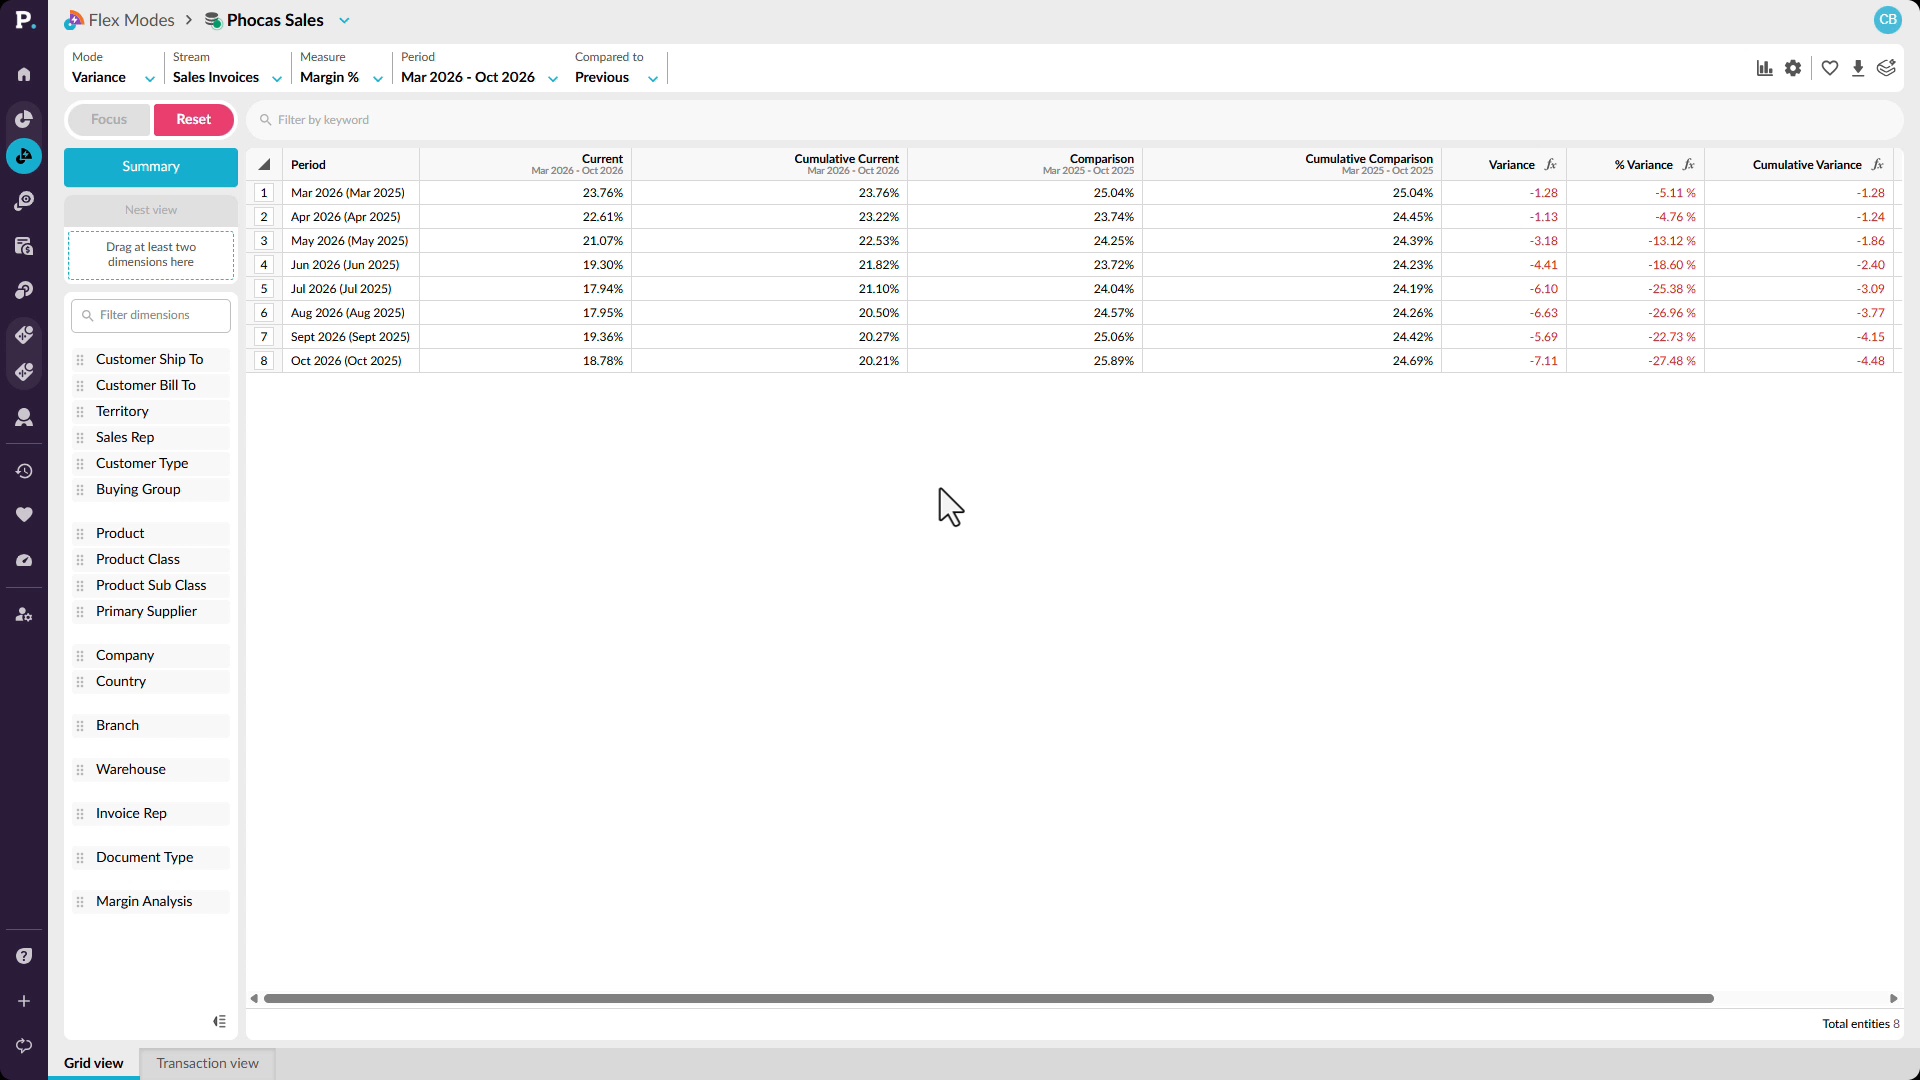
Trace a change in margin from the overall trend down to the customers and transactions behind it. Start by comparing margin percentage across rolling 12-month periods, then narrow the analysis to the months where performance has declined. From there, see how to identify customers contributing to the negative variance and move into transaction-level detail. You can bring in additional information such as salespeople, products, and product classes to keep investigating the cause, helping you answer questions about a margin anomaly without waiting for a separate report.
 Analytics
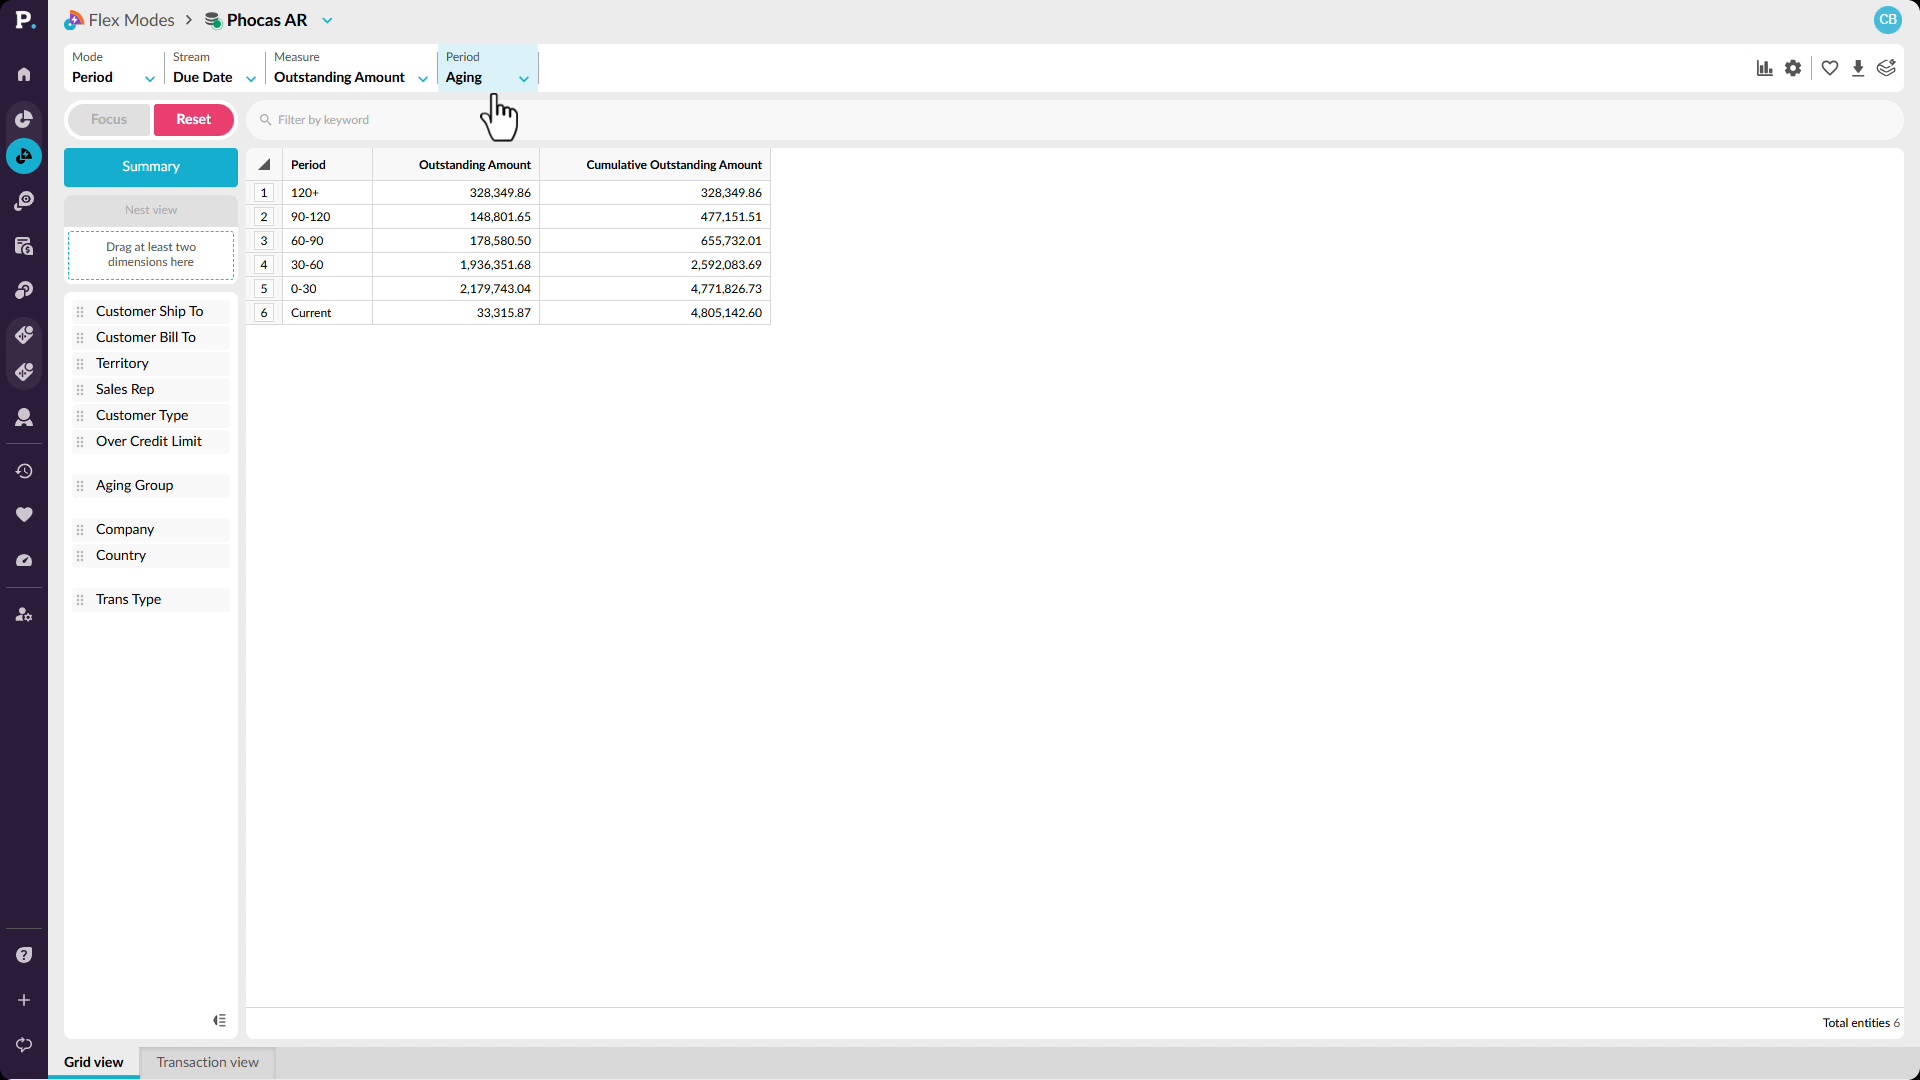
See the whole business, not a slice
See receivables across the wider business and quickly narrow in on the areas that need attention. Start with an aging view that brings outstanding amounts from across entities, branches, product lines, and customers into one analysis. You’ll see how to switch the view to compare trading entities, focus on a specific aging bucket, and then move down to the customers contributing to that balance. By filtering for overdue amounts, you can identify accounts receivable risk earlier and understand where it sits before it reaches your financial reporting.
 Analytics
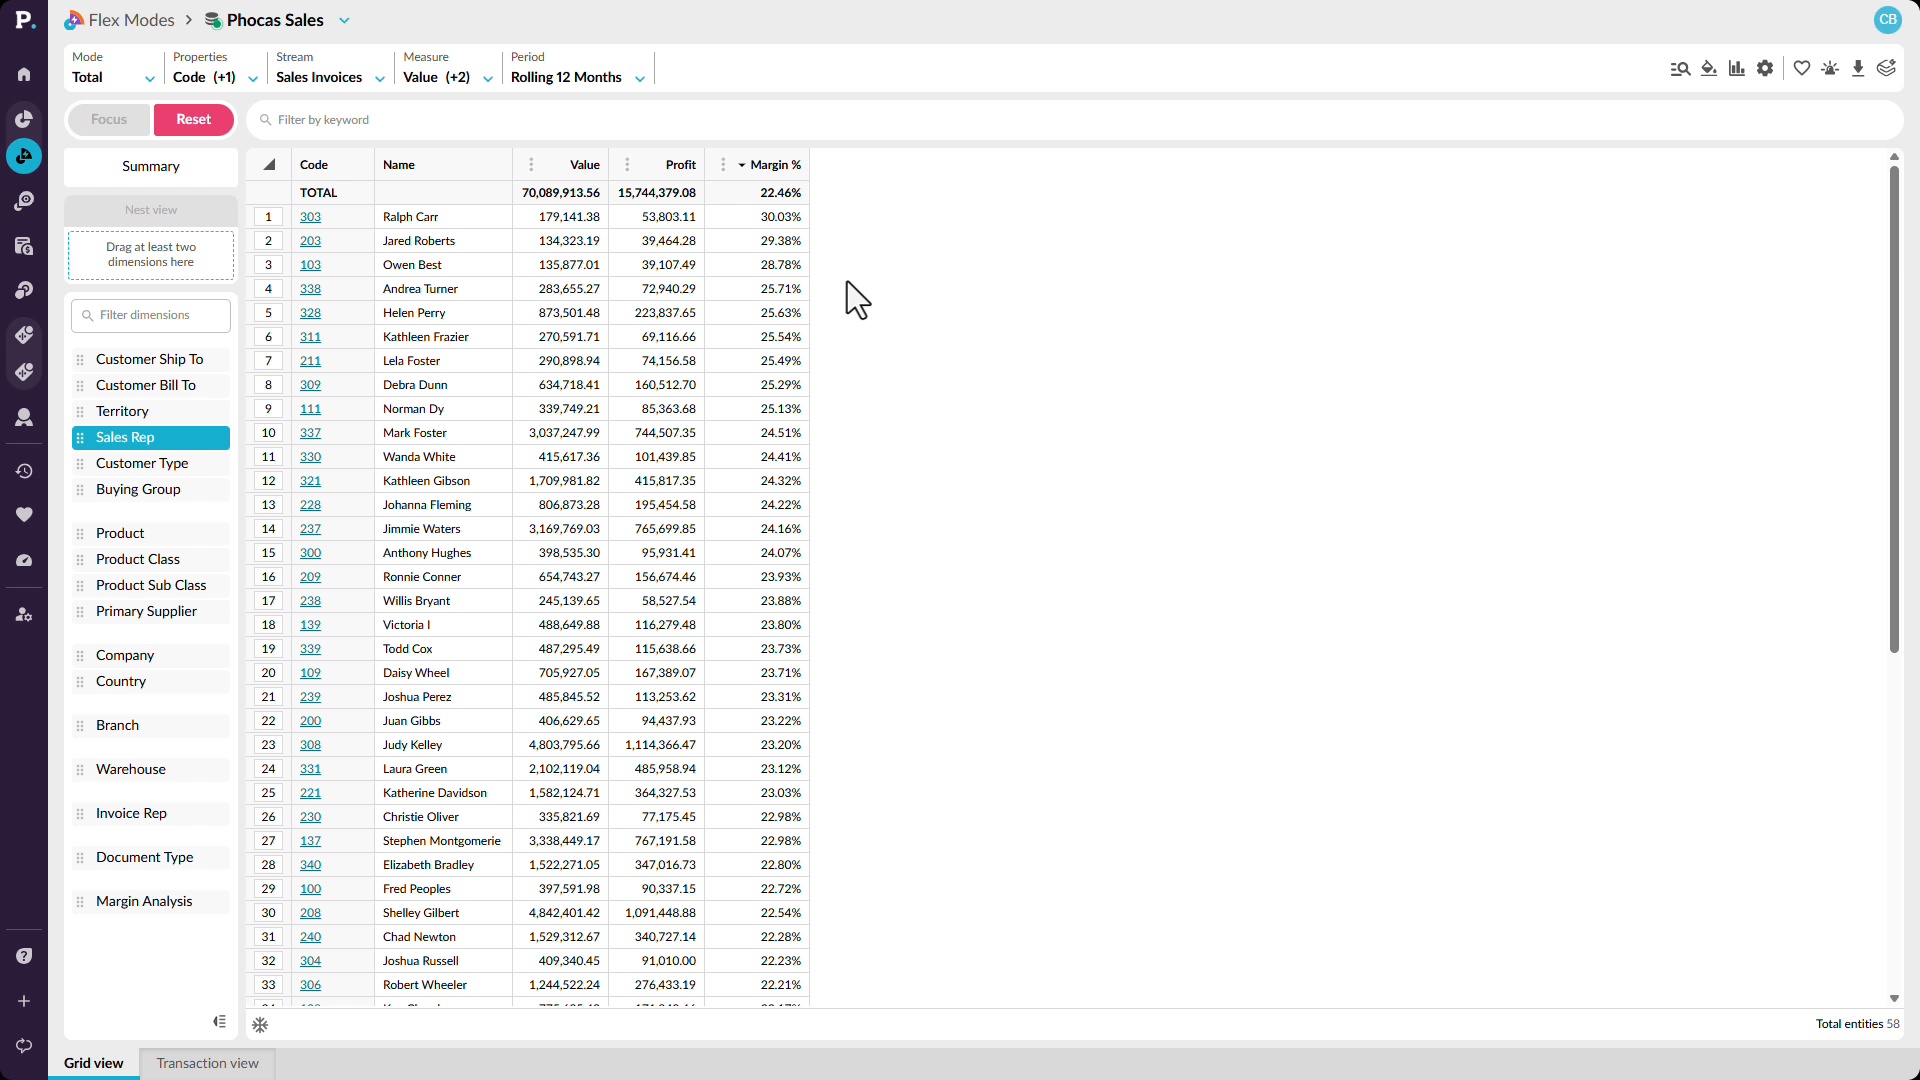
Find where the value really is
Look beyond revenue to understand which customers, sales reps, products, or locations are actually contributing the most value. See how to add profit and margin percentage alongside sales, identify changes in margin over time, and break the results down by sales rep. You can compare high-revenue performers with those delivering stronger margins, then focus on a particular rep and continue drilling into product categories and individual products. This helps reveal where strong sales are also profitable, and where apparently good performance may be hiding weaker margins.
 Analytics
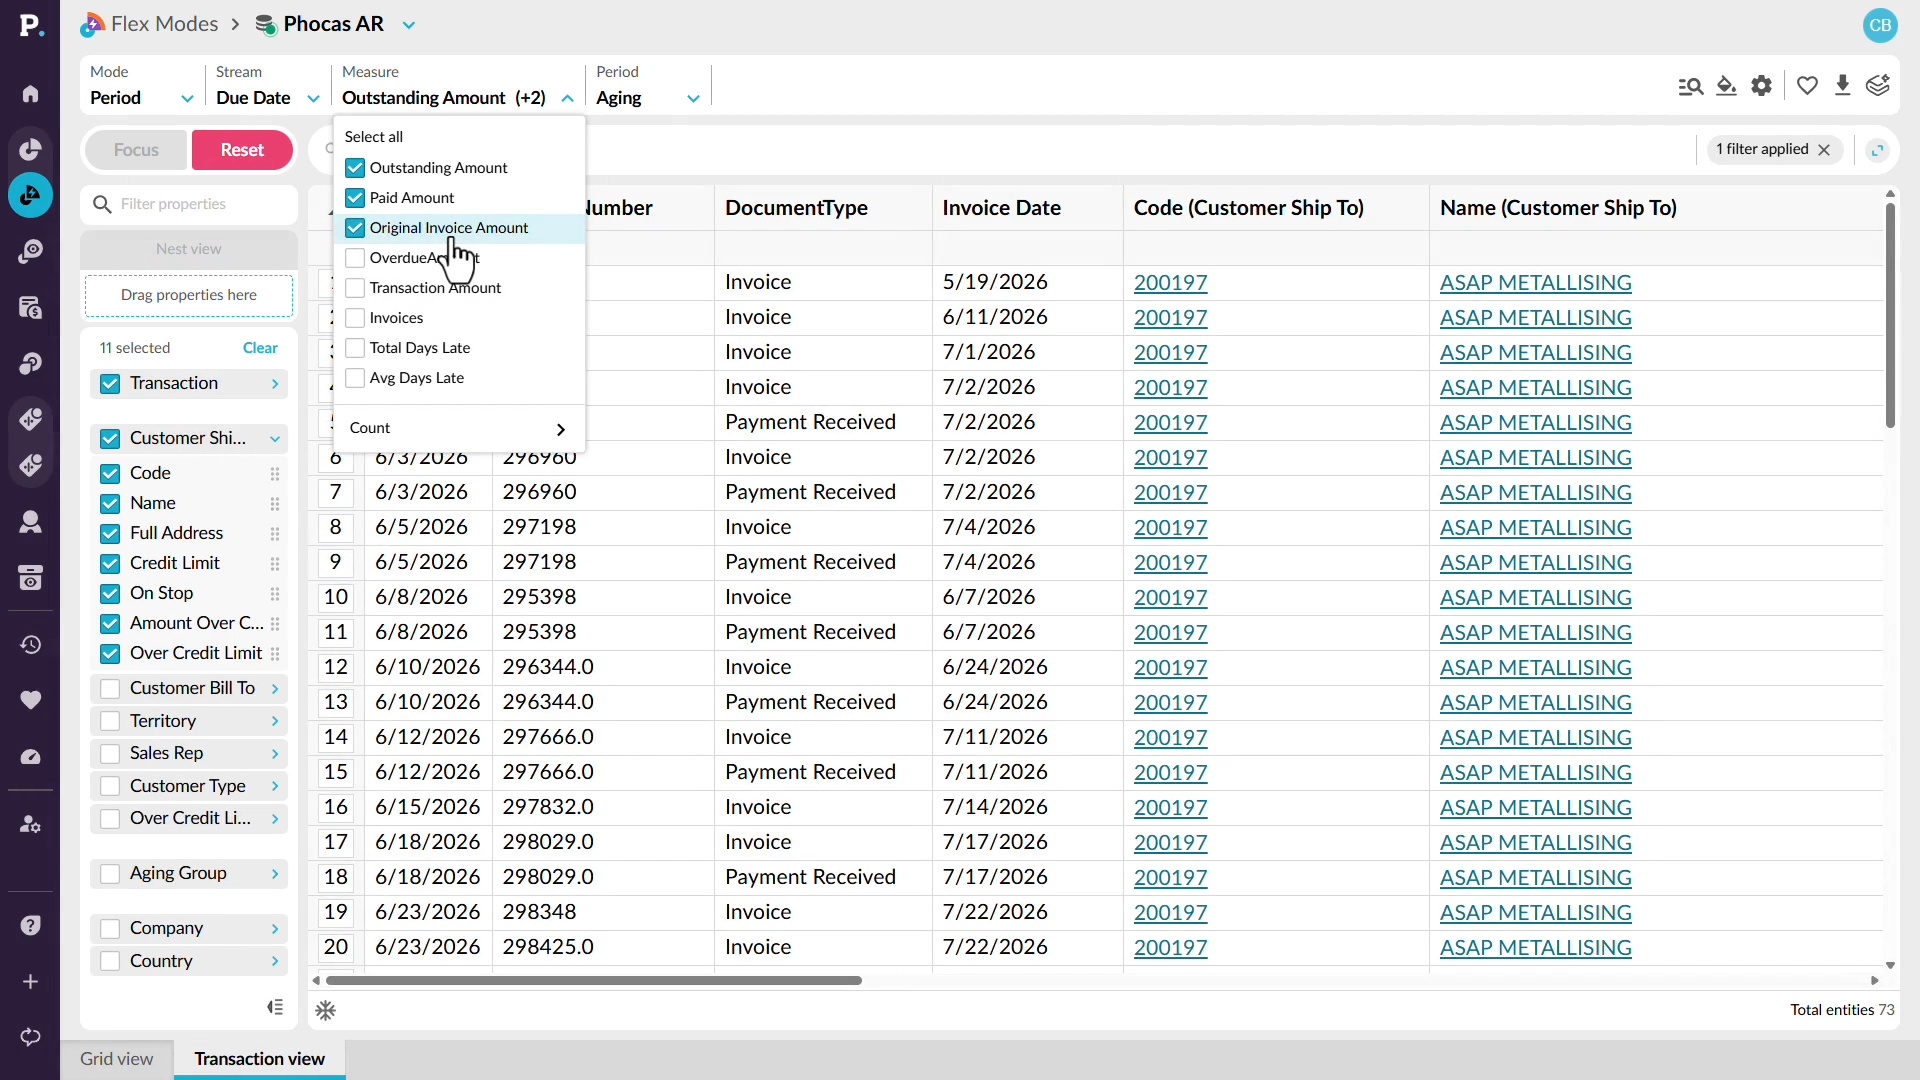
Chase the numbers down yourself
Investigate outstanding receivables without relying on another team to find the detail for you. See how to switch to an aging view, identify customers with the highest outstanding balances, and move from summary figures into the transactions behind them. You can then focus on a specific customer and review outstanding invoices alongside information such as credit limits, payments, and original invoice amounts. This gives you the context you need to understand what is contributing to the balance and follow it through to the underlying detail.
 Analytics
Use alerts
Learn how to monitor important results with alerts. You'll set the metric and red, yellow, and green thresholds, choose when you're notified, and set up email delivery. You'll also test an alert before creating it, subscribe to shared alerts, and restore deleted alerts within 45 days.
 Analytics
View transactions
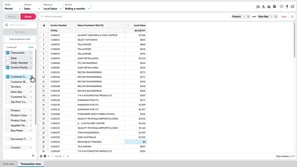
Learn how to see the individual records behind your results, such as invoices. You'll compare Transaction view and Transaction mode, choose transaction and dimension properties as columns, nest by invoice number, search, filter, and add calculations to dig deeper.
 Analytics
Copy or export data
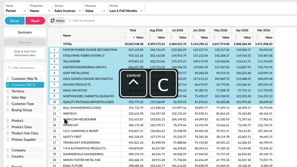
Learn how to take data out of the grid and use it elsewhere. You'll copy selected cells into Excel or Google Sheets, or export a wider set as CSV or XLSX. XLSX exports keep conditional formatting and nested rows, so your view carries across.
 Analytics
Switch modes
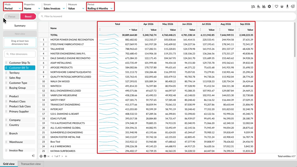
Learn how to change how data appears in the grid by switching between Period, Variance, Stream, Total, and Transaction modes. You'll also move between Summary and Dimension views, and see how your selections and filters carry across, so you can compare the same analysis in different ways.
 Analytics
Change the period
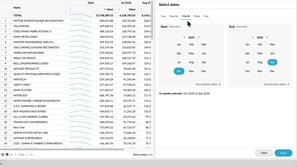
Learn how to change the period so you can focus on the time frame you want to review. You'll choose from available periods, select a fixed date range, and save a user-defined period with dynamic dates, so it keeps showing the latest months without you recreating it.
 Analytics
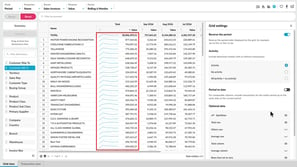
Manage grid settings
Learn how to tailor the grid with grid settings. You'll reverse the period order, show items with or without activity, align incomplete periods with Period to Date, and add sparklines, totals, and an Others row. You'll also see how to handle rows that net to zero and change the font size.
 Analytics
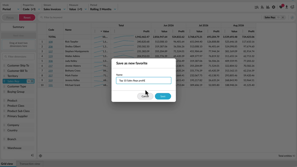
Save and share favorites
Learn how to save an analysis view as a favorite so you can return to it without setting everything up again. You'll see how to save, update, and delete favorites, share them with other users, save a copy as a new favorite, and subscribe to receive one by email on a schedule.
 Analytics
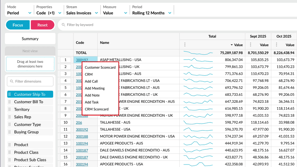
Work with the grid
Learn how to work efficiently with the grid. You'll sort values, collapse the dimensions panel for more room, freeze property columns while you scroll, page through large result sets, and select values to see their average, count, and sum. You'll also use right-click actions and keyboard shortcuts.
 Sales Insights
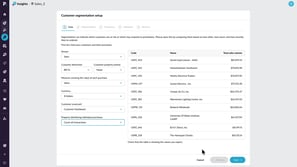
Set up a database
Learn how to configure a database for Customer segmentation in Insights. This tutorial walks through selecting your data, setting segmentation groups, and defining Frequency, Monetary, and Recency thresholds so you can start analyzing customer behavior.
 CRM
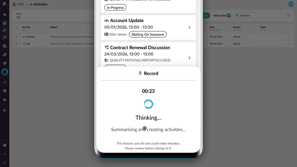
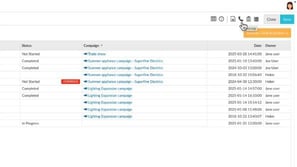
Create activities with AI voice
 CRM
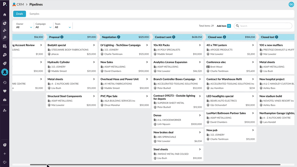
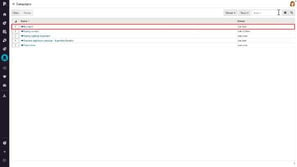
Use pipelines to track sales progress

 Financial Statements
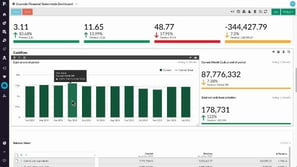
Edit a financial statement
 Analytics
Add and manage columns
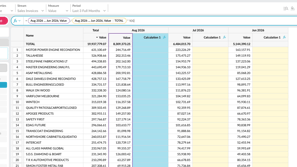
Learn how to shape the grid around your analysis by adding calculation and measure columns, applying number formats, and checking formulas in the FX bar. You'll also see how to resize, hide, duplicate, or delete columns, and save the view as a favorite to keep your changes.
 Financial Statements
Create a budget from within financial statements
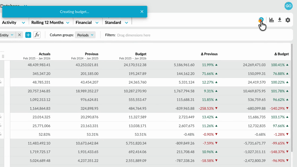
Learn how to quickly create a profit and loss budget from your financial statements using one click budgeting and start working in a ready-to-use workbook.
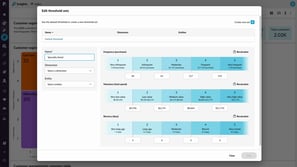 Sales Insights
Edit threshold sets for specific customer groups
Discover how to make your customer segmentation more accurate by using threshold sets. Learn how to customise thresholds for different groups and ensure your insights reflect how each part of your business performs.
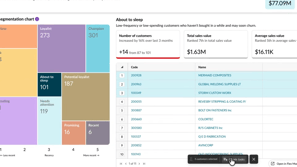 Sales Insights
Create CRM tasks from customer segments
Discover how to turn customer insights into action by identifying key segments and creating CRM tasks in bulk. This approach helps you stay organised, prioritise follow-ups, and manage customer activity more effectively.
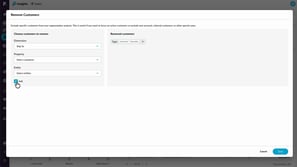 Sales Insights
Exclude customers from Sales Insights calculations
Learn how to use the Remove customers option to exclude specific customers from Insights calculations. You’ll see how exclusions immediately affect customer counts and revenue totals, and how removing customers differs from filtering by excluding them entirely from segmentation and Insights results.
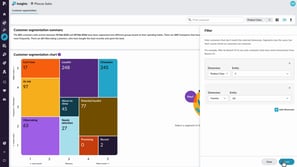 Sales Insights
Filter and resegment customers
Learn how to use filtering and re-segmenting to analyse your customers from different perspectives. This tutorial explains the difference between narrowing your view and recalculating customer behavior, helping you uncover deeper insights and identify opportunities within specific areas of your business.
 Financial Statements
Set up elimination journals
Learn how to set up and post elimination journals in Phocas Financial Statements. This video covers the full elimination workflow, from creating an elimination entity and enabling elimination-only accounts to posting journals in Data Entry. It also shows how eliminations are kept separate from ERP actuals, helping you report clearly while maintaining a clean audit trail.
 Rebates
Analyze rebates using dashboards
 Rebates
Analyze near-miss rebates
 Rebates
Analyze rebate performance
 Analytics
Create advanced filters
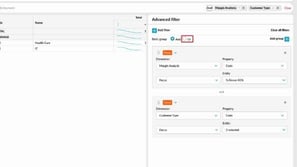
Learn how to answer more complex questions with advanced filters. You'll build rules from condition, focus or exclude, and keyword types, combine them with and or or logic, and group rules to create more precise queries. You'll also see how to remove rules or clear all filters.
 Platform
Get started as a Viewer
Viewer licenses are for users who mainly need to view data rather than analyze it. Learn where to find and open the assets available to you as a Viewer.
 Financial Statements
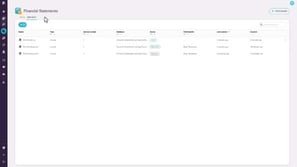
Find your intercompany journals
 Financial Statements
Create an intercompany journal
 Sales Insights
Get started with Sales Insights
While you likely know your top customers, those who buy less often or spend less can be easy to overlook. Customer segmentation helps you stay on top of your data by automatically analyzing buying behavior to group customers and uncover insights.
 Budgets & Forecasts
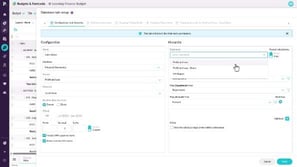
Add detail to your budget
 Budgets & Forecasts
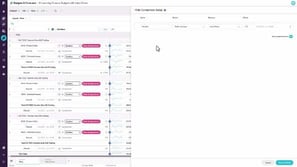
Set up comparison rows
 Budgets & Forecasts
Manage the workflow
 Budgets & Forecasts
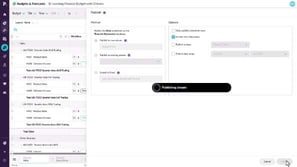
Publish a budget
 Budgets & Forecasts
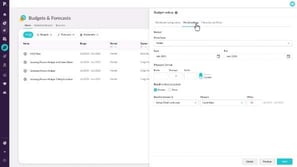
Create a budget workbook
 Analytics
Create a nested view
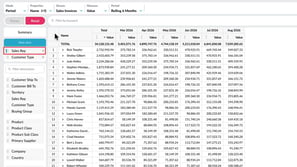
Learn how to build a nested view by dragging up to six dimensions into the nest view box, so you can expand each level to see how detail contributes to the overall result. You'll also see how to reorder or remove levels and add another dimension for more detail.
 Analytics
Take a tour of Analytics
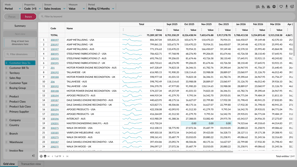
Learn how to find your way around Analytics and shape your view to answer the question you have. You'll see how the toolbar, dimensions panel, filter bar, and grid work together, and how to focus on data, filter it, nest dimensions, and open the transactions behind a result.
 Analytics
Compare data in a matrix
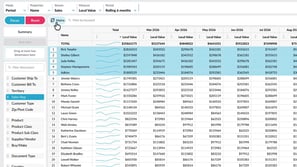
Learn how to compare data across two dimensions in a matrix, such as sales reps across customer types. You'll select the rows to compare, add a second dimension, and use focus and conditional formatting to refine the view. Pivot the matrix to switch rows and columns without rebuilding it.
 Analytics
Apply conditional formatting
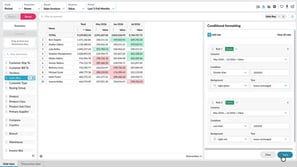
Learn how to highlight key values in the grid with color-based rules, so trends and outliers stand out without sorting or filtering. You'll set conditions such as greater than or less than, choose background colors, and edit or remove rules. Conditional formatting is saved with favorites and carries over when you export to Excel.
 Analytics
Filter data
Learn how to narrow the grid to the rows that matter. You'll focus on specific items, exclude data you don't need, search for matching values, and apply conditions such as greater than from the right-click menu. You'll also see how filter tags work, and how to remove one filter, clear them all, or reset.
 Budgets & Forecasts
Use sum and working lines
 Budgets & Forecasts
Take a tour of Budgets & Forecasts
 Budgets & Forecasts
Access the budget and your tasks
 Budgets & Forecasts
Change the grid layout
 Budgets & Forecasts
Edit values in a worksheet
 Budgets & Forecasts
Filter the data
 Budgets & Forecasts
Use formulas
 CRM
Integrate your Microsoft 365 Outlook calendar
 Financial Statements
Budget by region and branch
 Analytics (Classic)
Narrow your search by entity or property
 Analytics (Classic)
Use custom mode to show target performance
 Analytics (Classic)
Add your own defined period
 Analytics (Classic)
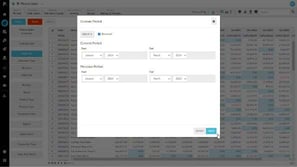
Apply a custom period
 Analytics (Classic)
Sort and summarize your data
 Analytics (Classic)
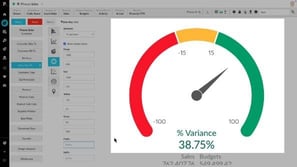
Create KPI-style gauge, summary and bullet charts
 Analytics (Classic)
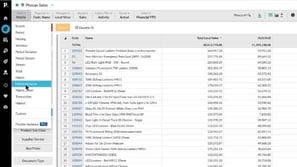
Use Matrix Variance and Matrix Share mode
 CRM
View and update accounts in CRM
 CRM
Manage campaigns
 CRM
Add an activity
 Financial Statements
Add a financial statement
 Financial Statements
View and explore dashboards
 Administration
Monitor user activity
Learn how to monitor your team's Phocas usage and gain insights into the databases they’re accessing, the favorites and dashboards they’ve created, and the queries they’ve run.
 Administration
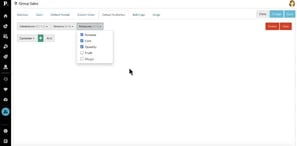
Manage default database restrictions
Learn how to manage default restrictions for all users with access to a database, making it easy to set up a secure, default configuration.
 Analytics (Classic)
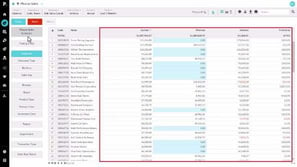
Change the mode
 Financial Statements
Manage streams and scenarios
 Financial Statements
Map accounts to a group
 Financial Statements
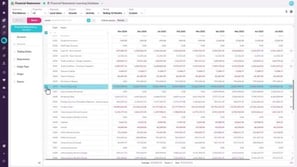
Set up your Trial Balance statement
 Analytics (Classic)
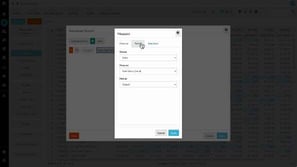
Perform an advanced search
 Financial Statements
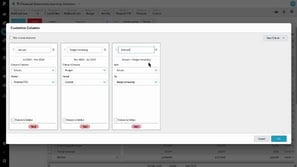
Customize columns
 Budgets & Forecasts
Create a budget
 Financial Statements
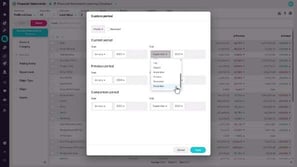
Apply a custom period (Financial Statements)
 Financial Statements
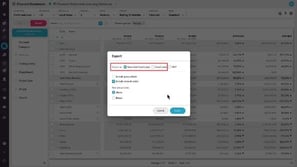
Copy or export financial information
 Financial Statements
View transactions (Financial Statements)
 Financial Statements
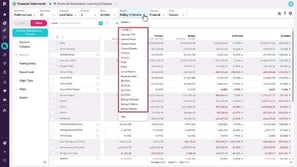
Manage statement levels
 Financial Statements
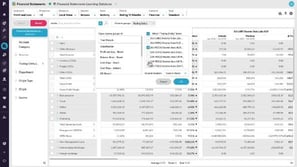
View financial information in a matrix (change column groups)
 Financial Statements
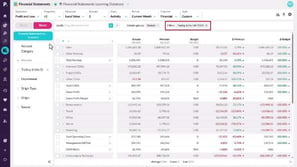
Change the period (Financial Statements)
 Financial Statements
Filter data (Financial Statements)
 Analytics (Classic)
Phocas AI
 Administration
Manage favorites, dashboards, and subscriptions
Learn how to manage and share favorites and dashboards with users, and discover how to subscribe them to email notifications to keep them updated on important changes in key data.

 Rebates
Configure retrospective rules
 Rebates
Configure pro rata rules
 Rebates
Post calculation results

 Rebates
Create a rule (initial setup)

 Analytics (Classic)
Find your way around Phocas
 Financial Statements
Use multiple currencies
 Budgets & Forecasts
Contribute to the workflow
 Financial Statements
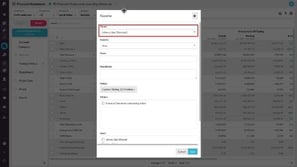
Add financial analysis to a dashboard
 Financial Statements
Save and share favorites
 Financial Statements
View financial information in a chart
 Financial Statements
Change the columns
 Financial Statements
Take a tour of Financial Statements
 Budgets & Forecasts
Spread totals
 Budgets & Forecasts
Use comparison rows
 Analytics (Classic)
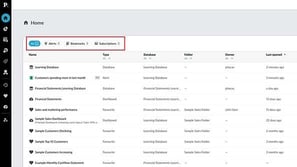
Homepage at a glance
 Analytics (Classic)
Visualize your data in a chart
 Analytics (Classic)
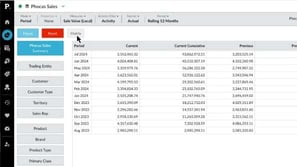
Compare data with Matrix mode
 Analytics (Classic)
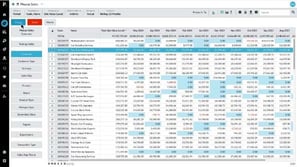
Focus on data
 Financial Statements
Highlight financial performance using a waterfall chart
 Budgets & Forecasts
Explore the forecast workbook
 Budgets & Forecasts
Create a forecast
 Financial Statements
Reference a single account code in calculations
 Financial Statements
Create an indirect Cash Flow statement using 'hide rows'
 Financial Statements
Combine statistical and financial data for better business insights
 Financial Statements
Bring statistical streams into a Financial Statements database
 Budgets & Forecasts
How to handle key variables, such as currency, in the budget


 Budgets & Forecasts
Understanding workflow and task assignment
 Financial Statements
Customize your Cash Flow Statement
 Financial Statements
Add a custom calculation to your Income Statement
 Analytics (Classic)
Set your default period for a database
 CRM
Map accounts
 Analytics (Classic)
Add levels (grid nesting)
 CRM
Manage activities in My agenda
 CRM
Use the CRM analysis dashboard
 CRM
Manage contacts and leads
 Analytics (Classic)
Compare multiple data streams
 Analytics (Classic)
Change the period (Analytics Classic)
 Administration
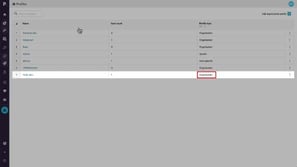
Assign and edit user profiles
Learn how to assign and edit profiles, from organization profiles you can apply to multiple users to user specific profiles tailored to individuals.
 Administration
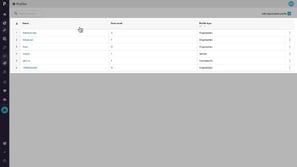
Add an organization profile
Discover the default profiles you can assign, such as Administrator, Advanced, Basic, and Viewer, and find out how you can create custom organization profiles to better suit your needs.
 Analytics (Classic)
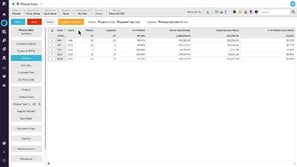
Use Market Mode to analyze market penetration
 Administration
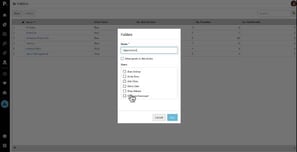
Manage folders
Learn how to organize user favorites and dashboards into folders within a database. Discover how to create, rename, or delete folders and manage access permissions for each one.
 Analytics (Classic)
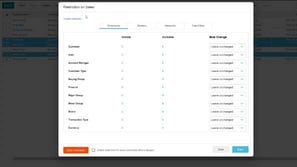
Configure the chart options
Administration Update users in bulk
Learn how to save time by applying settings, permissions and database restrictions to multiple users at once using Bulk Update. This is often the next step after importing users.
 Administration
Importing users with CSV Import
 Administration
Clone a user
Discover how the Clone feature allows you to quickly create a new user by copying the settings from an existing user, saving you time and eliminating the need to manually configure everything from scratch.
 Administration
Add users
This video for Phocas administrators takes you through some simple steps to create a new user in Phocas, including assigning a profile, giving access to a database, and cloning existing users to save time when setting up new users.
 Administration
Add a defined period using Dynamic Month option
In this video for administrators, Tina shows how to use the Dynamic Month offsets option to add to the Period menu, with a date range that updates each new calendar or financial year.
 Administration
Set defined periods for a database
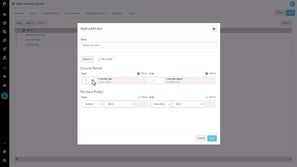
As an administrator, you can control which defined periods (date ranges) appear in the Period dropdown for each database in Phocas. Learn how to create a new period with a dynamic 'offset' date range for automatic updates, or select from a list of pre-built periods.
 Administration
Create a working days calendar
Learn how to create a working days calendar to exclude non-working days, such as weekends and public holidays, for more accurate average daily values for your users.
 Administration
Reset and expire passwords
Learn how you can reset user passwords for single or multiple users, and force users to change passwords at their next login.
 Administration
Add a defined period using Special Offsets (days)
In this video for administrators Tina shows how to add a defined period using a special offset that matches a day with a corresponding day in a previous month.
 Administration
Manage a user's database access and restrictions
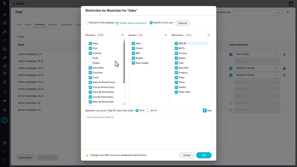
Learn how to apply user restrictions in Phocas to control what data individuals or groups can access, so you can ensure users only see the information relevant to their role.
 Platform
Set a dashboard as your home page
 Analytics (Classic)
Create an interactive dashboard
 Platform
Use dashboards
 Analytics (Classic)
Forecast months of stock on hand (custom mode)
 Analytics (Classic)
Create a 'low margin' alert
 Analytics (Classic)
Show positive or negative variance
 Analytics (Classic)
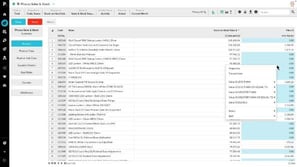
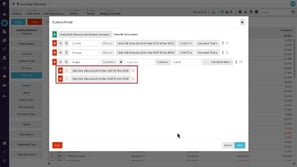
Combine inventory and sales to find dead stock
 Analytics (Classic)
Generate a budget based on previous sales (custom mode)
 Analytics (Classic)
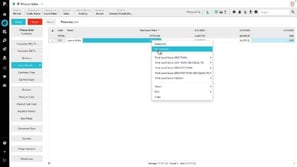
What did I sell yesterday? (using transaction mode)
 Analytics (Classic)
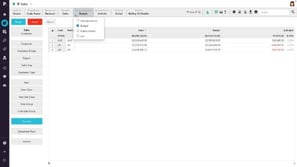
Examine accounts receivable over 90 days
 Analytics (Classic)
Track sales rep performance against budget
 Analytics (Classic)
Work with the grid (Analytics Classic)
 Analytics (Classic)
Save a favorite
 Analytics (Classic)
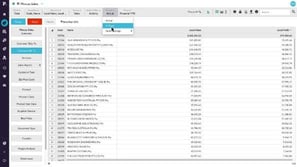
Get more options for viewing data
 Analytics (Classic)
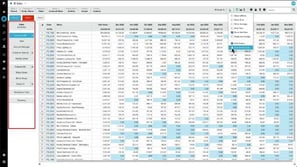
Change the data format
 Analytics (Classic)
Gain more screen space and other tips
Hmmm...
We couldn't find any matches "".
Try removing a filter or changing your search term.

