Create KPI-style gauge, summary and bullet charts
3:25 min
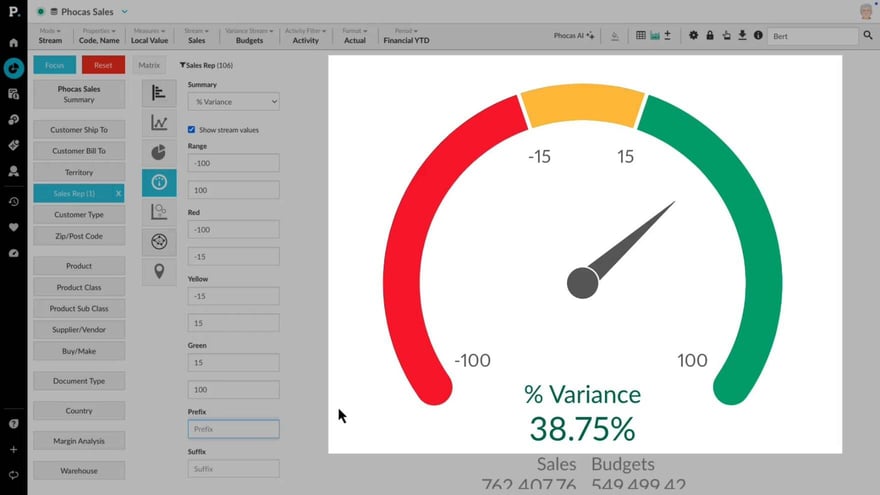
Discover how to track key performance indicators using KPI chart types in an Analytics database. In chart view, explore Gauge, Bullet, and Summary charts to visualize business goals and targets, ensuring performance insights are clear and easy to monitor.
Supporting documentation
Phocas product  Analytics
Analytics Category

Related video tutorials
 Rebates
 Analyze rebates using dashboards
Learn how to use Rebates dashboards to analyze performance and track rebate activity, helping you understand trends and make informed decisions.
11:07 min
 Financial Statements
 View and explore dashboards
Discover just how user-friendly a Phocas Financial Statements dashboard can be! Learn how to make simple selections, narrow your focus, clear filters, and reset the dashboard with ease.
2:29 min
 Platform
 Manage favorites, dashboards, and subscriptions
Learn how to manage and share favorites and dashboards with users, and discover how to subscribe them to email notifications to keep them updated on important changes in key data.
3:19 min
 Financial Statements
 Add financial analysis to a dashboard
Add the views and visualizations you use often to a dashboard for quick and easy insights.
2:24 min