Change the period (Analytics Classic)

Learn how every figure in the grid is tied to a period, which sets the date range and the basis for comparing current and previous values. Choose a predefined period, check the dates it uses, and, with the right permissions, apply a temporary custom period or save a user defined period with fixed or dynamic dates. You can also change a database's default period from the homepage.
Supporting documentation

Related video tutorials
 Analytics (Classic)
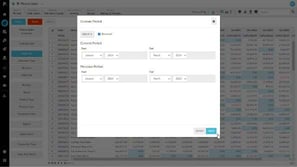
Apply a custom period
Learn how to set a custom period by choosing a time unit, deciding whether the grid shows the most recent data first, and picking start and end dates for the current period. The previous period updates to one year earlier automatically, and you can change it if needed. Once applied, the grid shows the data for that temporary date range, with the range displayed in the status bar.
 Financial Statements
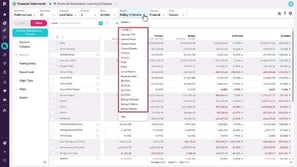
Change the period (Financial Statements)
Learn how to use predefined, custom, and user defined periods to control the date range shown in your financial statements. User defined periods can have fixed or dynamic dates. You can also set a default period for a database, so it's applied automatically each time you open it.
 Dashboards
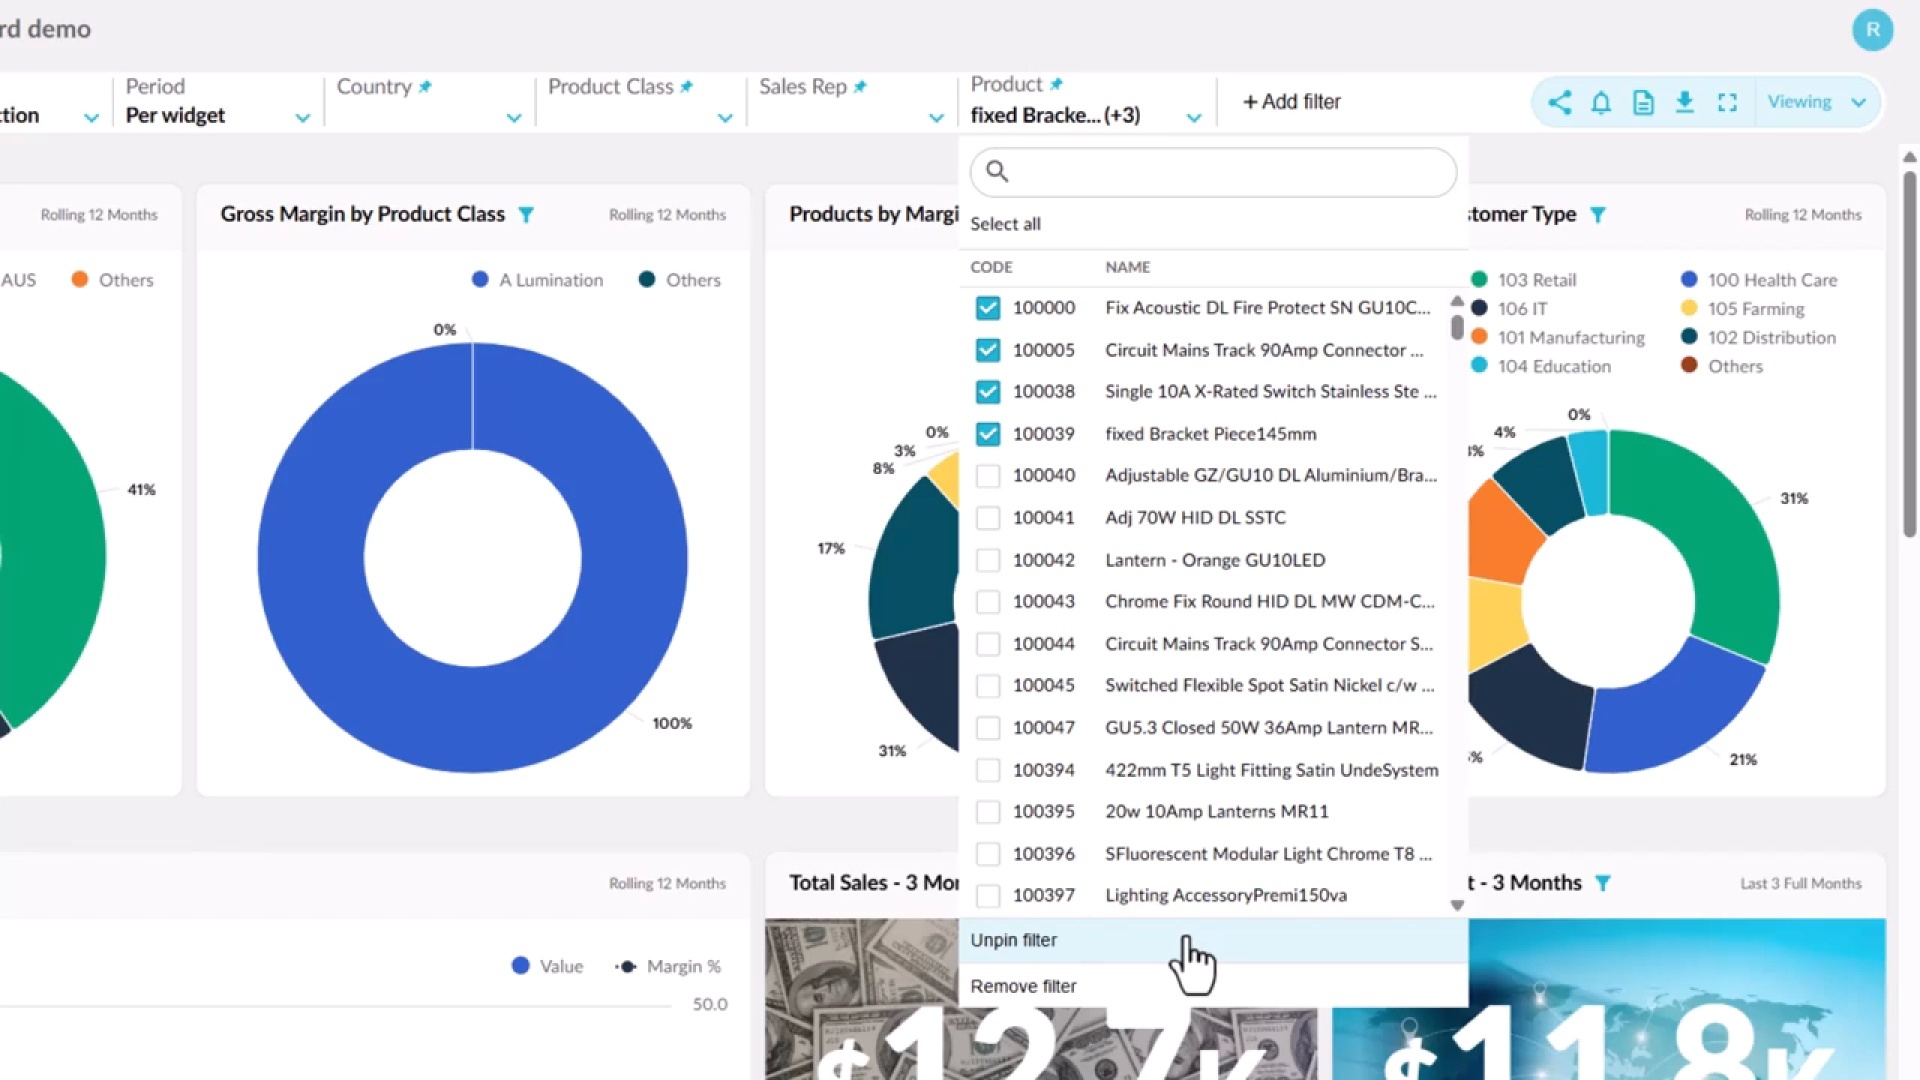
Filter your dashboard
Learn how connected widgets highlight the same entity across a dashboard, and how Focus filters everything down to your selection. You'll add and pin your own filters, see which widgets respond to them, and apply a single period across every widget, then use Reset to return to the default view.
 Analytics
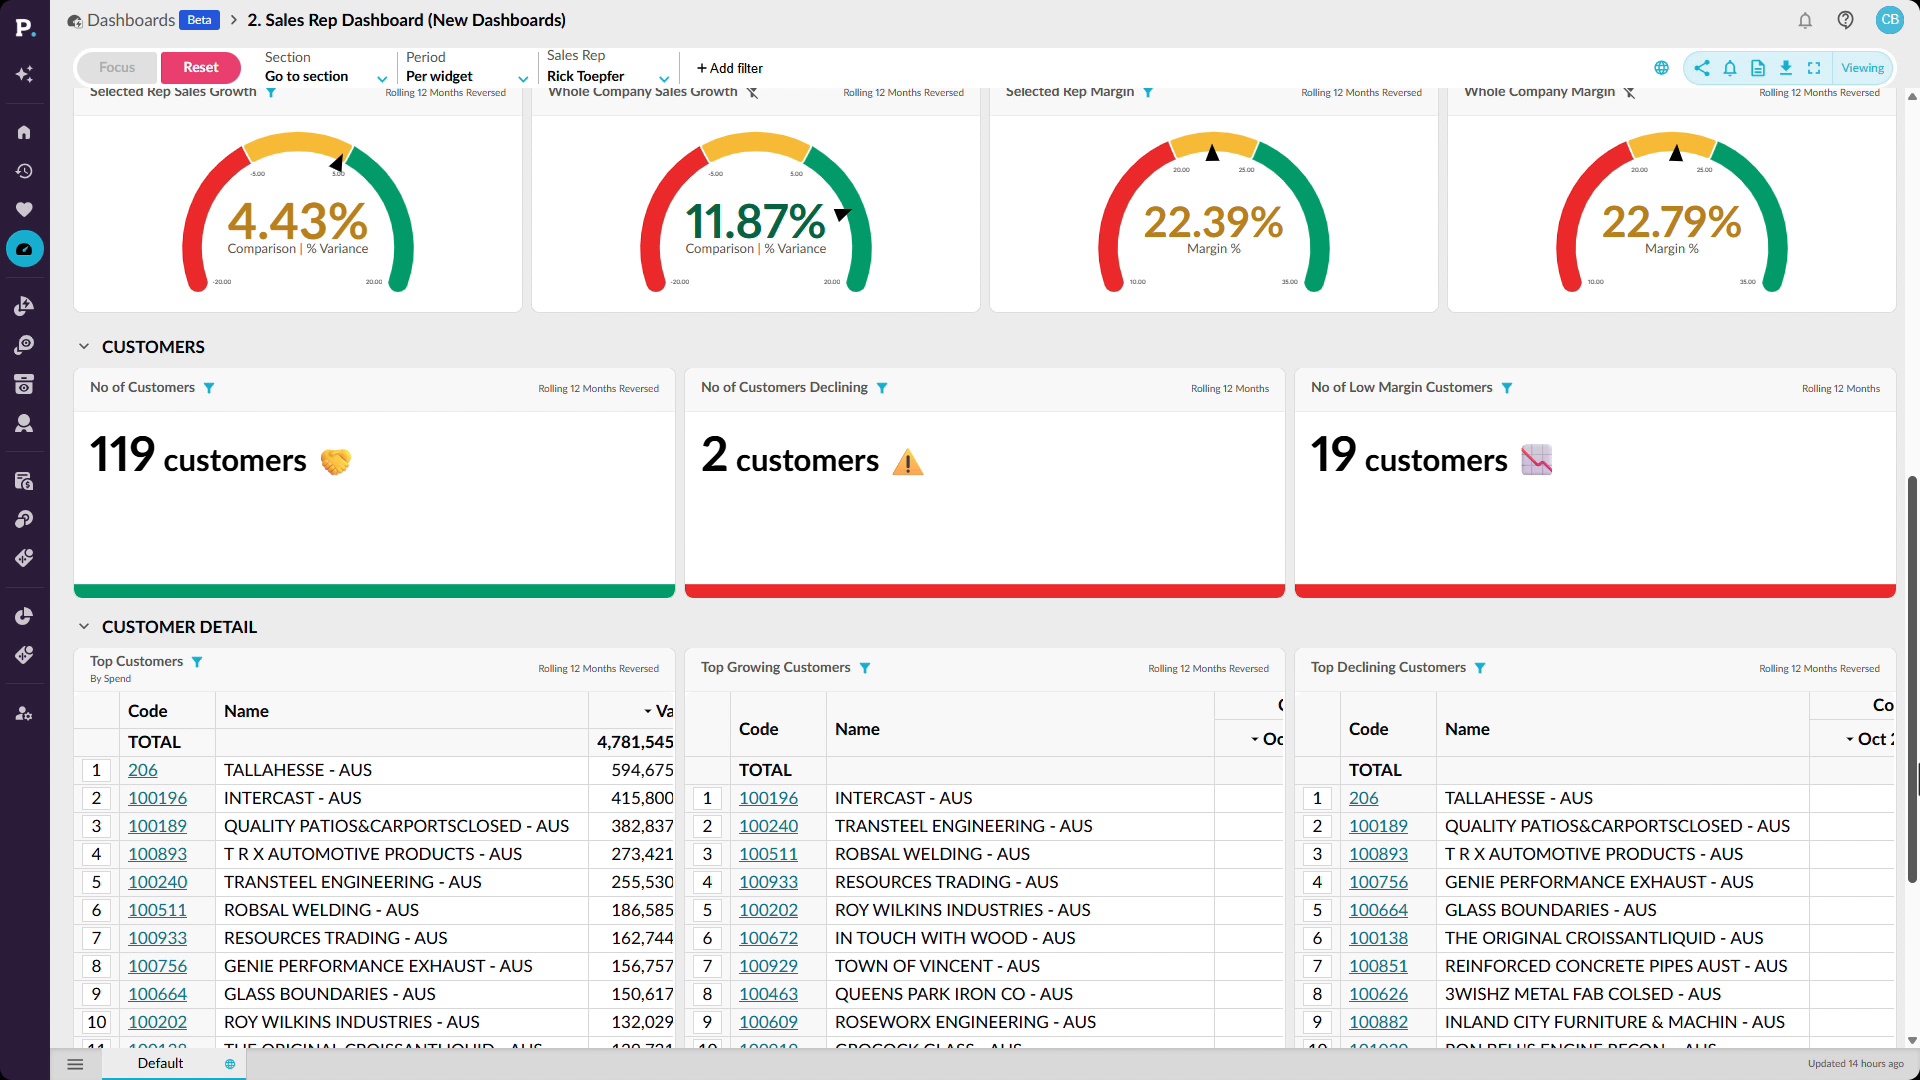
Catch an off-track rep in time
Learn how to put rep performance against quota into your team's hands with a dashboard that updates automatically and filters by salesperson or region. Then compare sales with budget year to date by rep and isolate those running below budget, so you can step in early. Add the report to a dashboard, save it as a favorite, or export it.
