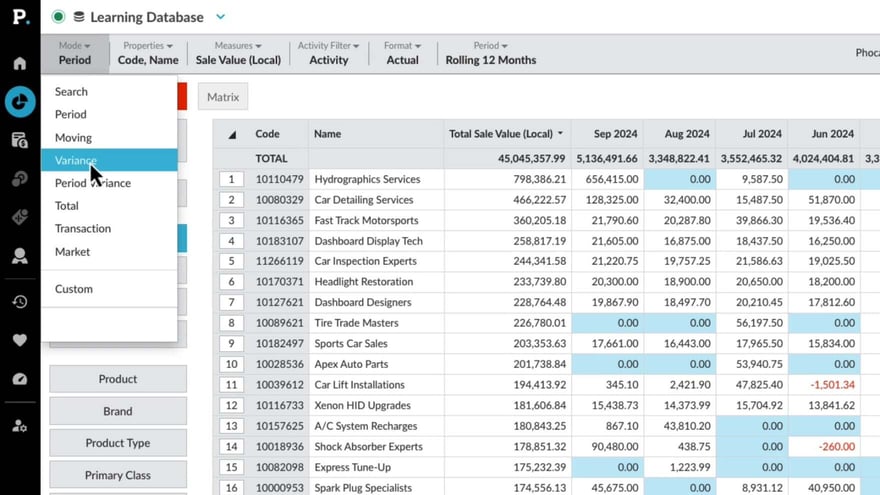
Show positive or negative variance
Supporting documentation
 Analytics
Related video tutorials
 Analytics
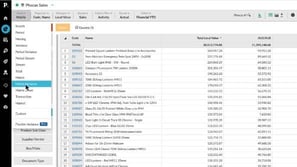
 Use Matrix Variance and Matrix Share mode
 Analytics
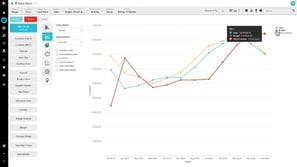
 Compare multiple data streams
 Flex Modes
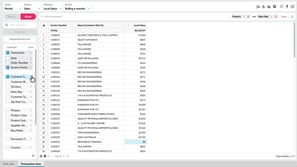
 View transactions
Learn how to work with transaction-level data in Phocas to investigate the detail behind your analysis. Explore the difference between Transaction view and Transaction mode, add transaction and dimension properties, sort and nest data, apply filters, and create calculations. Working at this level helps you trace results back to individual records, isolate specific invoices, and organize transaction data so you can investigate results in more detail.
 Flex Modes
 Switch modes
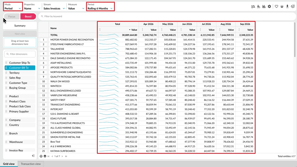
Learn how to switch between modes and views to analyze your data in different ways. See how Period, Variance, Stream, Total, and Transaction modes change what appears in the grid, and how Summary and Dimension views help you move between an overall result and more detailed analysis. You’ll also see how selections and filters can carry across supported views, so you can compare the same data from different perspectives without rebuilding your setup.