Use Matrix Variance and Matrix Share mode
3:13 min
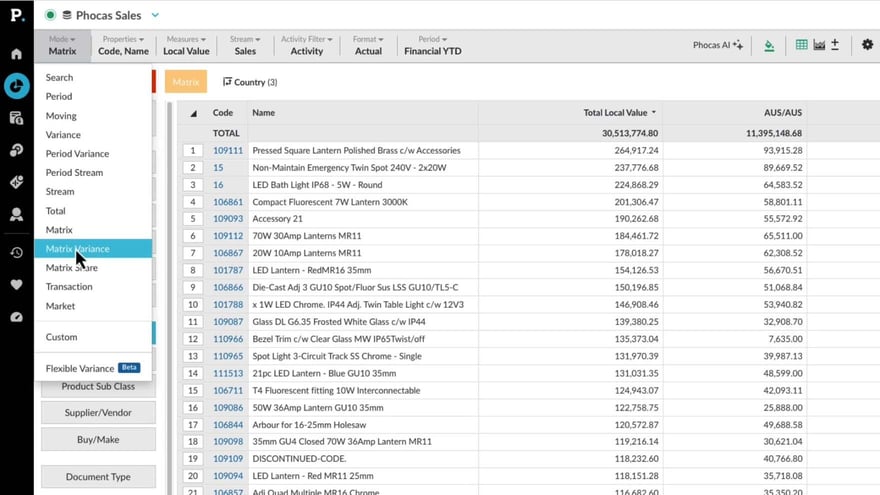
Learn how to use Matrix Variance mode to compare data across different periods by adding columns for the previous period and variance—perfect for spotting trends month-over-month or year-over-year. You'll also see how Matrix Share mode transforms your data into percentages, making it easy to analyze ratios, like the share of Product X versus Product Y.
Supporting documentation
Phocas product  Analytics
Analytics Category

Related video tutorials
 Analytics
 Compare data with Matrix mode
Discover how to use a simple matrix tool to compare sales performance across regions, branches, or products side-by-side, and identify opportunities for cross-selling within your customer base.
1:46 min
 Analytics
 Compare multiple data streams
Learn how to compare multiple streams of data in Phocas, both in the grid and on a chart, and how to easily and quickly include variance data.
1:54 min
 Analytics
 Show positive or negative variance
Learn how to switch to variance mode to see where results are improving or struggling. We’ll show you how to compare different periods and switch between customers, products, or any other dimension effortlessly.
1:41 min
 Flex Modes
 View transactions
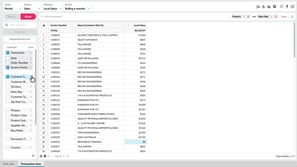
Learn how to work with transaction-level data in Phocas to investigate the detail behind your analysis. Explore the difference between Transaction view and Transaction mode, add transaction and dimension properties, sort and nest data, apply filters, and create calculations. Working at this level helps you trace results back to individual records, isolate specific invoices, and organize transaction data so you can investigate results in more detail.
3:25 min