When leading a sales team, all roads must lead to revenue-generating opportunities. And with data considered the most important business asset, you need to consolidate and aggregate your data so you can analyze it accurately. Finding and measuring sales revenue is easy with data analytics, and the new insight will help you reach your sales targets.
Measuring sales revenue
Sales revenue is a metric most businesses measure. As the main source of income for retail, manufacturing, and wholesale businesses, it is incredibly important that revenue is not only tracked but understood.
In Phocas, a dashboard can be set up containing key information such as your sales revenue year on year, sales compared to a target or budget, or by sales consultant or product group. Each dashboard is interactive, and clicking an element on the dashboard lets you dive deeper into the selected data.
An example of a dashboard is below comparing different regions YTD sales figures with the previous year and in the second line: charts showing where the revenue has come from broken down by industry, product class and sales rep.
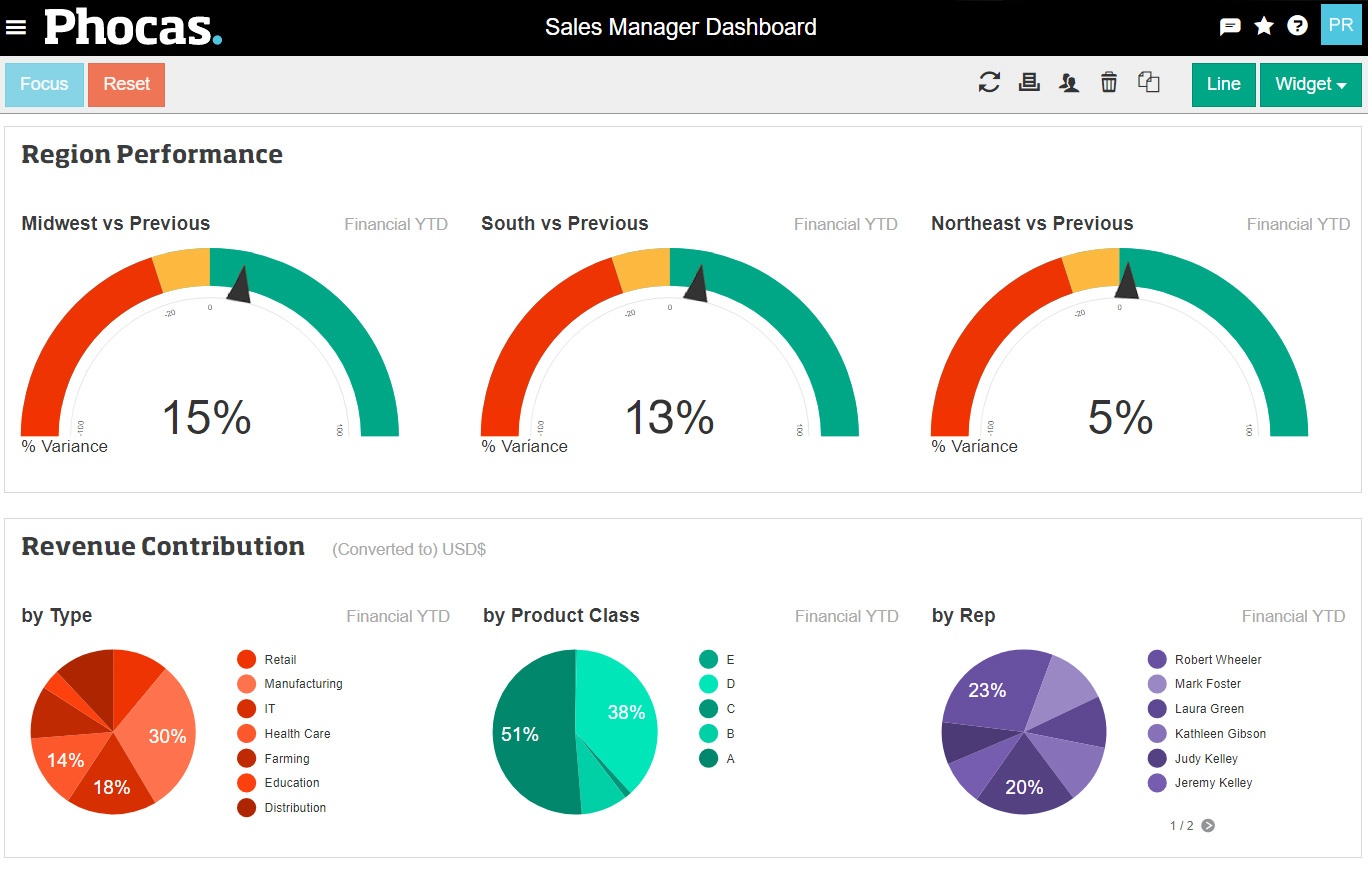
Your dashboard may tell you that you are on track to meet your targets. However, when you drill in deeper, you may see that the individual sales consultants are performing differently. One may be performing well, while another may be underperforming.
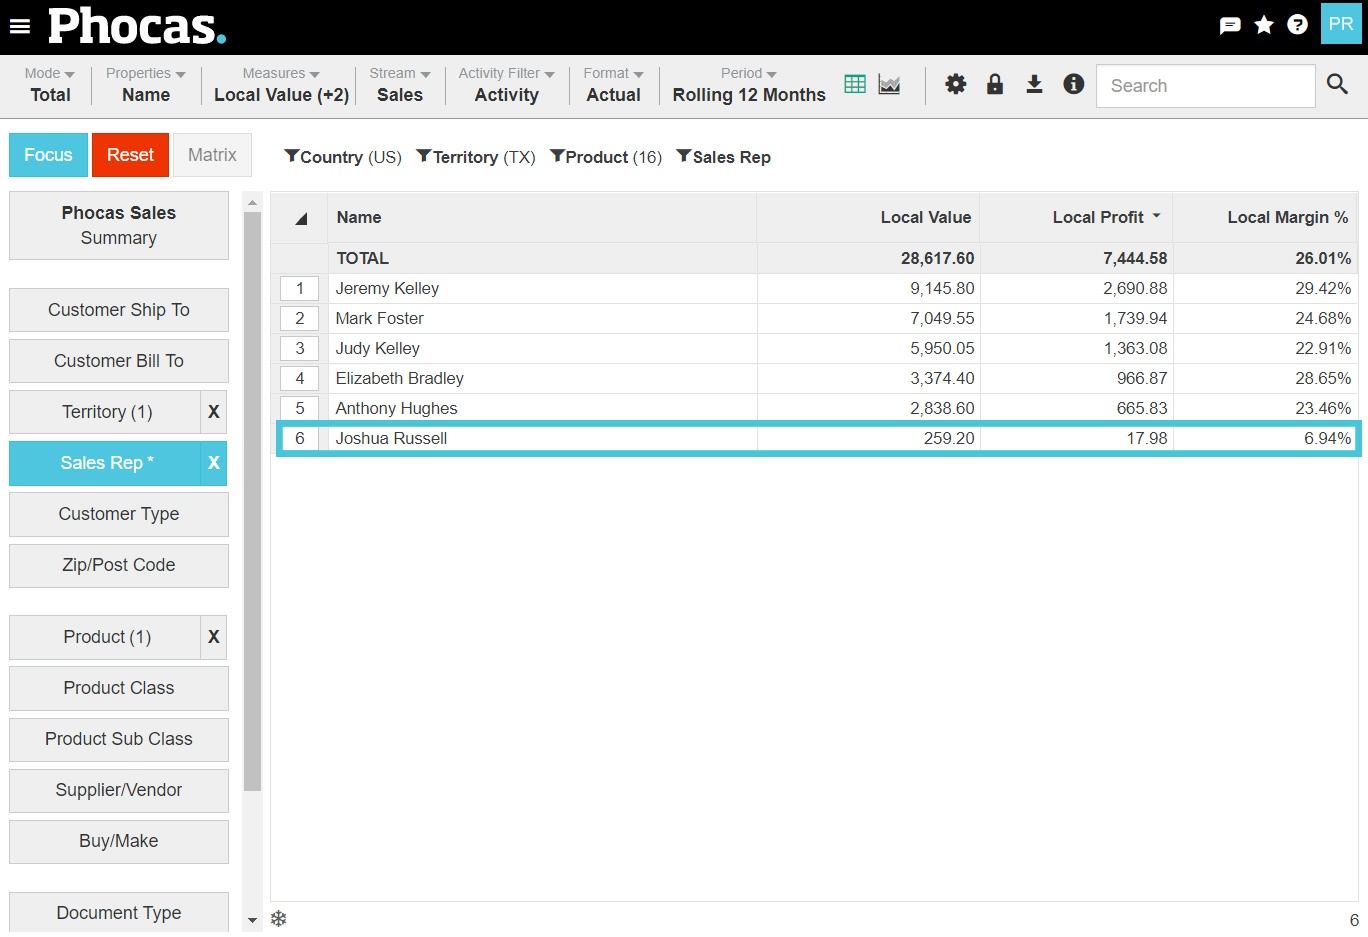
In the example below, we can see that six sales consultants in Texas have made sales of a product (LED light bulbs – 5W round) over the past 12 months. Five members of the sales team have made $2,800+ worth of sales but Joshua Russell has made just $259 worth of sales. He is also selling the products at a lower margin (6.94%) than his colleagues who are all selling at 23%+ margins. As a result, the profit Joshua is bringing into the business for this product is just $17.98 which is far below the top performer ($2,690). Armed with these insights, Joshua’s manager can consider giving him some product training to ensure he knows the benefits of LED lights so he can lift his sales.
Measuring lost sales
In the example above, we discussed how you can help your sales team sell more of a product. With Phocas, you can also uncover when customers stop buying from you before you lose them completely.
In the example below, you can see Joshua Russell's sales. In 2020, his sales for specific customers were below 2019. Hard Chrome Sales contributed $65,062 in 2019 but in 2020 just $7901.63. Also in 2020, six of Joshua's customers purchased nothing from the business. Are these customers purchasing their products elsewhere? If so, that may be hundreds of thousands of dollars of lost orders for your business.

With Phocas, you can monitor how much your customers have purchased on a daily, weekly, monthly or annual basis to identify their spending trends. Rather than losing revenue when your customers gradually purchase less from you and eventually stop buying, Phocas gives you the insights so you can reach out before it is too late.
Finding cross-sell opportunities
A common way to boost revenue is by identifying opportunities for cross-selling. Cross-selling refers to the concept of selling a complementary product when a given product is already being purchased. For example, many electrical distributors may expect to sell both LED lights and transformers to their customers. If you find you are only selling transformers, your customer may be purchasing LEDs from another supplier. There could be multiple reasons for this; the customer may receive a better price elsewhere, they may not be aware you sell the product, or they may buy some of the product but supplement it with a different brand from another supplier.
See below how easy it is to tell who is buying one type of product but not another. On the left is LED sales and on the right is transformer sales. With Phocas, you can drill down into the individual product. The same analysis can be run in any business. A food and beverage business may want to see who is buying pasta but the not the sauce.

Phocas in your business
Phocas has almost 20 years of experience helping businesses drive sales revenue in retail, wholesale distribution and manufacturing. Our dashboards are provided as an out-of-the-box solution so you can make data driven decisions almost immediately. Phocas is easy to use for anyone, including those without a technical background. With Phocas, you can also decide who has access to your data, so that employees have access to data that is relevant to their role.


Empowering businesses with intuitive data analytics, driving informed decisions for growth and profitability. We make people feel good about data.
Related blog posts


Browse by category

Find out how our platform gives you the visibility you need to get more done.
Get your demo today