One central platform for all your BI and FP&A needs
Tired of wrangling multiple data sources? Does reporting and budget building leave little room for strategic planning? Phocas combines financial capabilities with consolidated data to bring you a comprehensive financial planning and analysis platform.

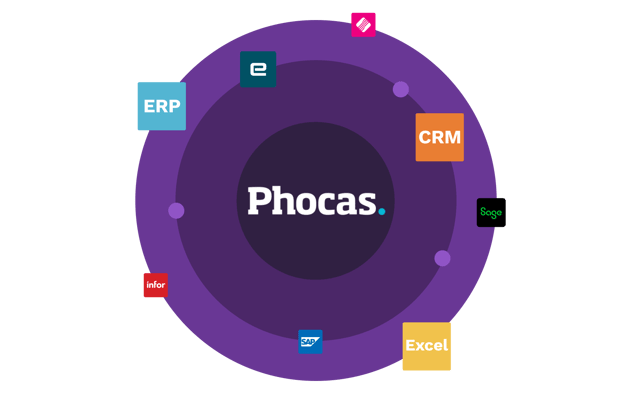
The Phocas product suite
Tired of managing a multitude of disparate systems? Phocas offers a suite of products that allows you to consolidate your BI and FP&A needs into one powerful, integrated platform.


Consolidate your tech stack
Simplify your day to day by moving away from juggling multiple logins, data integrations, vendor relationships. Bring all of your key business functions together
- Integrated solution: all products work together smoothly, using the same core data
- Start easy: choose products for your current needs (accessible data, self-serve reporting), and scale up later
- Fix more: tackle challenges simultaneously; self-serve analysis, smarter reporting, accurate planning, automated rebates
- Same page: align teams around up-to-date numbers to break silos and achieve goals collaboratively

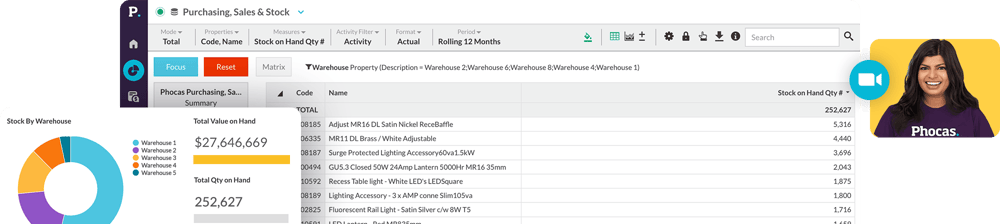
Data Analytics
Access a single source of data truth
- Consolidate ERP, CRM and multiple other data sources into one accessible financial planning and analysis platform
- With an intuitive interface and visualization tools, people of all skill levels can become more data-driven
- Hit the ground running with built-in dashboards, AI queries, customizable reports and ongoing support from real Phocas humans
Customer quote
Prior to Phocas no one trusted the data, and if there was something in the reports that was out they would blame the data. Now, if the report is showing a variance, people will consider other reasons for this because everyone is more informed and they trust the data.
— Muhsin Schroeder, Data Analyst at National Tiles.
Financial Statements
Customize to suit your business
- Automated reporting effortlessly consolidates both financial and operational data
- Gain more time for regular, deeper analysis and provide answers to on-the-spot questions in just a few clicks
- Make holistic business decisions based on complete data; chart the impact of your actions by tracking KPI trends and sharing data insights

Customer quote
Prior to Phocas, we had eleven Excel spreadsheets to make one report x 100. The many levels of reporting is an amazing feature. Reports are automated everyday without any human intervention.
— Adam Kiyuna, Business Systems Manager at Ellume Health.
Budgets and Forecasts
Collaborative budgeting, efficient forecasting
- Workflows allow financial and non-financial contributors to collaborate in real time, accelerating budget cycles and improving accuracy
- Use operational insights to drive your budget
- Easy-to-use interface, secure task assignment and real-time visibility of changes
- Move away from static Excel spreadsheets and turn budgets into living value-add tools for financial and non-financial engagement

Customer quote
The Budgeting and Forecasting tool has allowed us to automate and simplify the process and help us reduce mistakes. In Phocas, you have access to the audit trail, and you can see who's changed what and who has access to what. It makes the budgeting process a lot smoother."
— Daniel Lyons, Finance Manager at Fuzzy.
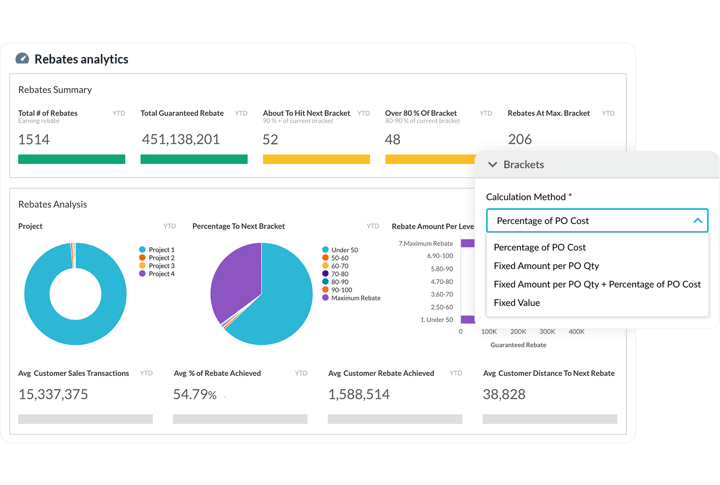
Rebates
Drive growth, secure margins and ensure accuracy
- Save time by setting up clear and flexible rules - from simple to complex, and ensure critical accuracy
- Make informed purchasing and inventory decisions and accurately forecast profits with automated real-time reporting
- Track rebates down to transactional level to maximize returns instantly
- Visual dashboards provide at-a-glance understanding of rebate performance
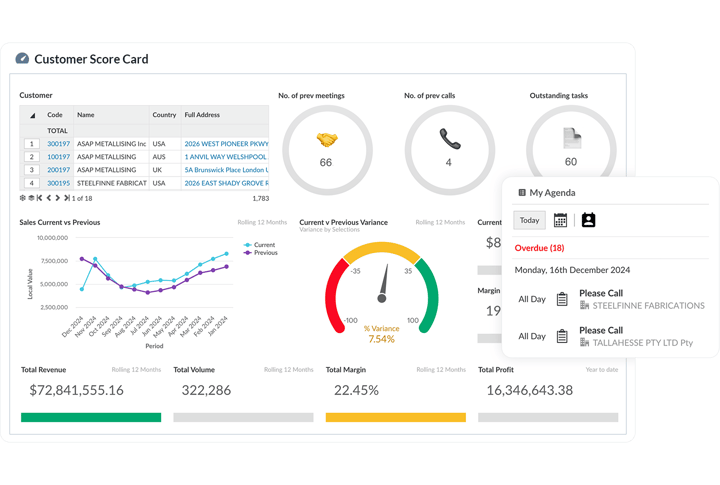
CRM
Unlock new opportunities by understanding your customers better
- Interlock CRM data with actual sales information and identify, track and analyze opportunities and risks, turning data analysis into action
- Gain complete clarity on what actions and activities drive customer revenue
We think you’ll love Phocas, but don’t take our word for it
Based on 270+ customer reviews


Understand the past, operate better today, and plan well for the future
Whether you want to get your data organized for your team or you’re looking to combine business intelligence capabilities with financial reporting, planning and forecasting… We can help.
Get a demo