Learning modules
Phocas Analytics QuickStart
This module for beginners takes you through getting started in Phocas Analytics and doing some simple analysis to get fast results from your data. These videos introduce you to features that you will be using every day.
9 videos
18:42 min
Financial Statements QuickStart
This module for beginners helps you get started in Phocas Financial Statements. Learn about the grid, layouts and charts and how to add a favorite view to your dashboard.
5 videos
12:29 min
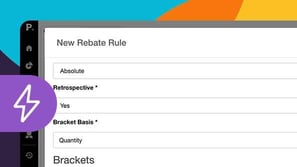
Rebates QuickStart
This module for beginners helps you get started in Rebate. Learn how to use Rebates, from setting up and configuring your first Rebates project though to calculating and posting rebates.
7 videos
12:53 min
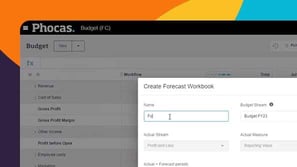
A simple way to re-forecast
Re-forecast as conditions change during the year, using your prepared budget as the starting point.
2 videos
4:03 min
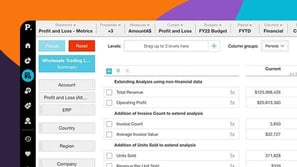
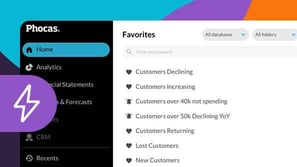
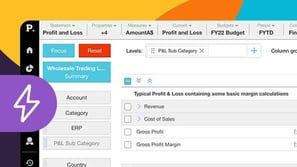
Analyze your financial statements
Discover how you can change statement views, apply filters, add detail, and drill down into your data to move smoothly from a high-level overview to detailed insights for deeper analysis.
7 videos
13:02 min
Grid customization basics
Want another way of looking at things? This module for beginners covers simple methods of customizing your view in the analysis grid.
5 videos
13:22 min
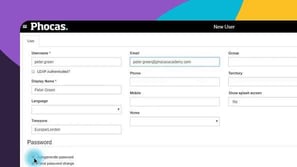
Set up users
This module covers the fundamentals of setting up new users in Phocas, including adding users, setting passwords, importing new users via CSV, and updating multiple users simultaneously using the bulk update feature.
5 videos
15:31 min
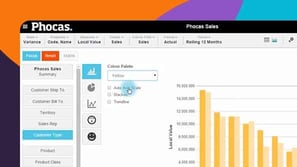
Turn data into a chart
Switching from grid to chart view opens up options for various graphical presentation of your data. This module covers basic chart setup through to advanced configuration, with a detailed look at some chart types.
3 videos
8:14 min
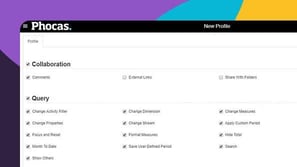
Profiles, permissions and restrictions
A user's profile defines their access and capabilities in Phocas. This module demonstrates how to assign profiles and permissions to individuals or groups, and how to efficiently manage data sharing across your Phocas site.
5 videos
12:43 min
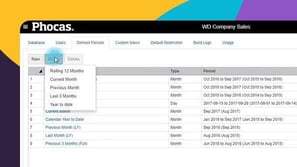
Defined periods
Administrators decide what defined periods (date ranges) appear in the Period dropdown menu for each database. Learn how to maintain these.
4 videos
12:13 min
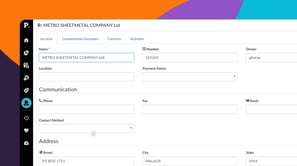
Phocas CRM
This module covers key CRM elements like activities, accounts, campaigns, and contacts—helping you and your team stay on top of customer management.
7 videos
20:03 min
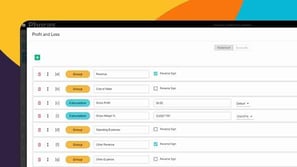
Customize your financial statements
Learn how you can customize financial statement layouts and contents to fit your organization's needs by adding, removing, and reordering items.
7 videos
20:42 min
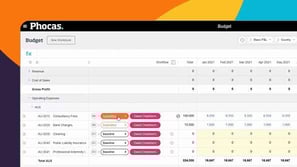
Phocas Budgets & Forecasts
Learn how to use the tools in Phocas Budgets & Forecasts to streamline your budgeting process, work collaboratively yet safely and control workflow. In this module of videos, see the results of combining an intuitive Phocas interface with familiar spreadsheet formats.
8 videos
22:48 min
Filter Learning modules
reset
 Help & support