Compare multiple data streams
1:54 min
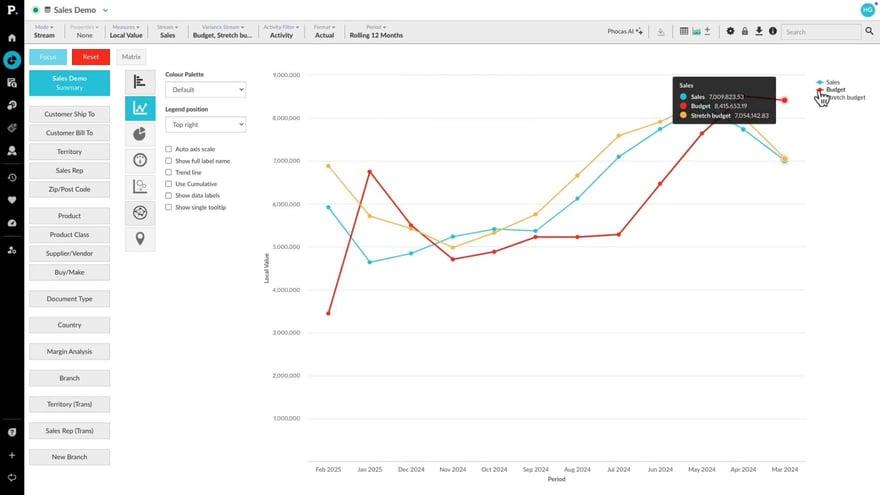
Learn how to compare multiple streams of data in Phocas, both in the grid and on a chart, and how to easily and quickly include variance data.
Supporting documentation
Phocas product  Analytics
Analytics Category

Related video tutorials
 Analytics
 Use Matrix Variance and Matrix Share mode
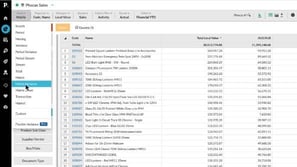
Learn how to use Matrix Variance mode to compare data across different periods by adding columns for the previous period and variance—perfect for spotting trends month-over-month or year-over-year. You'll also see how Matrix Share mode transforms your data into percentages, making it easy to analyze ratios, like the share of Product X versus Product Y.
3:13 min
 Analytics
 Show positive or negative variance
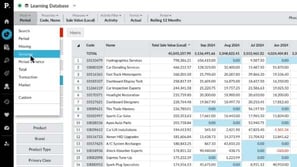
Learn how to switch to variance mode to see where results are improving or struggling. We’ll show you how to compare different periods and switch between customers, products, or any other dimension effortlessly.
1:41 min
 Flex Modes
 Switch modes
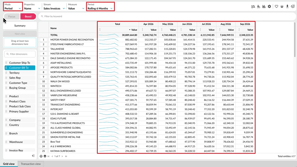
Learn how to switch between modes and views to analyze your data in different ways. See how Period, Variance, Stream, Total, and Transaction modes change what appears in the grid, and how Summary and Dimension views help you move between an overall result and more detailed analysis. You’ll also see how selections and filters can carry across supported views, so you can compare the same data from different perspectives without rebuilding your setup.
2:32 min
 Budgets & Forecasts
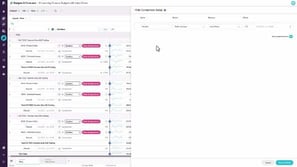
 Set up comparison rows
Learn how to set up comparison rows, such as last year’s actuals or forecasts, to give your team context for smarter, data-driven budget edits with instant variance insights.
3:14 min
 Financial Statements
  Rebates
  CRM
CRM  Sales Insights