Get your own answer in seconds
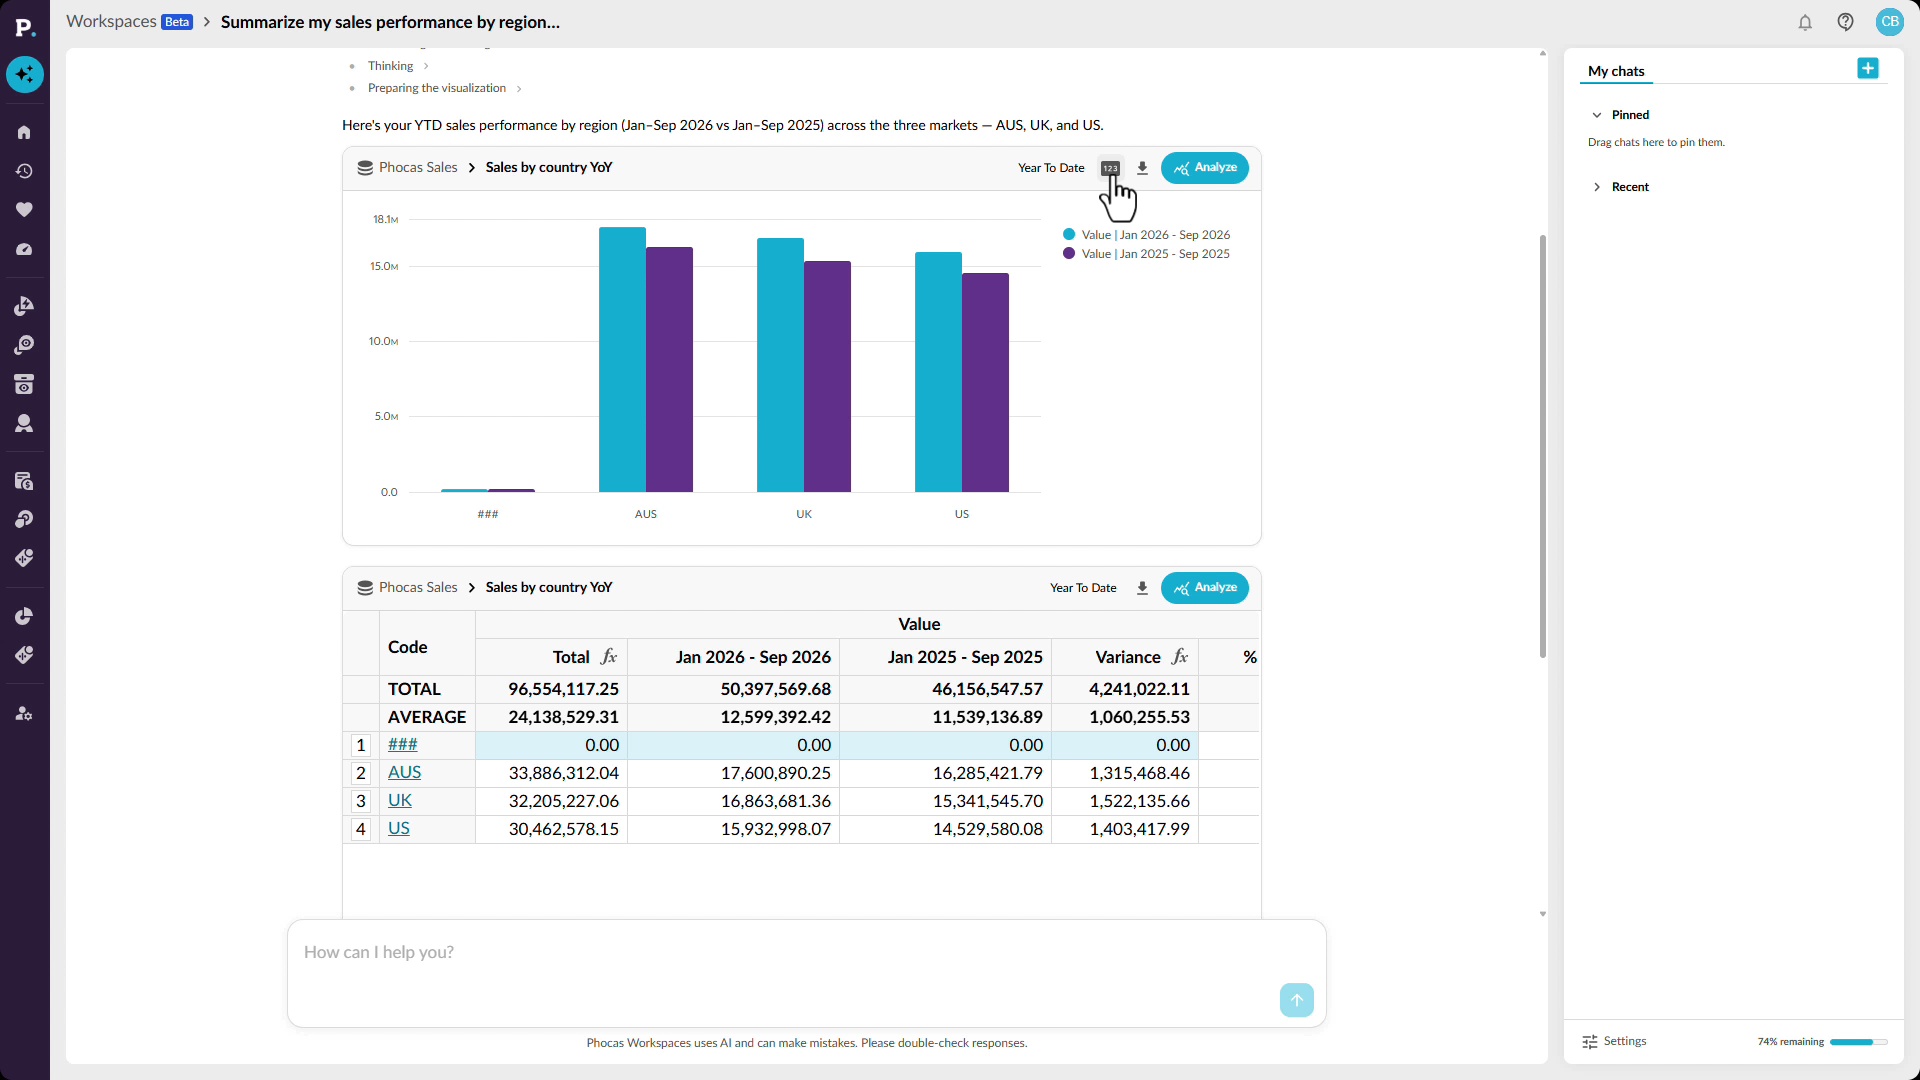
Ask questions about your data in plain language and get answers directly in Workspaces. See how conversational AI can return a chart or grid, highlight relevant figures, and provide observations that help explain the result. You can continue the analysis by asking follow-up questions or opening the result for a closer look. When you have what you need, you can save it as a favorite, add it to a dashboard, or export it to share with your team.
Supporting documentation
 Analytics

Related video tutorials
 Analytics
Stop losing stock to silence
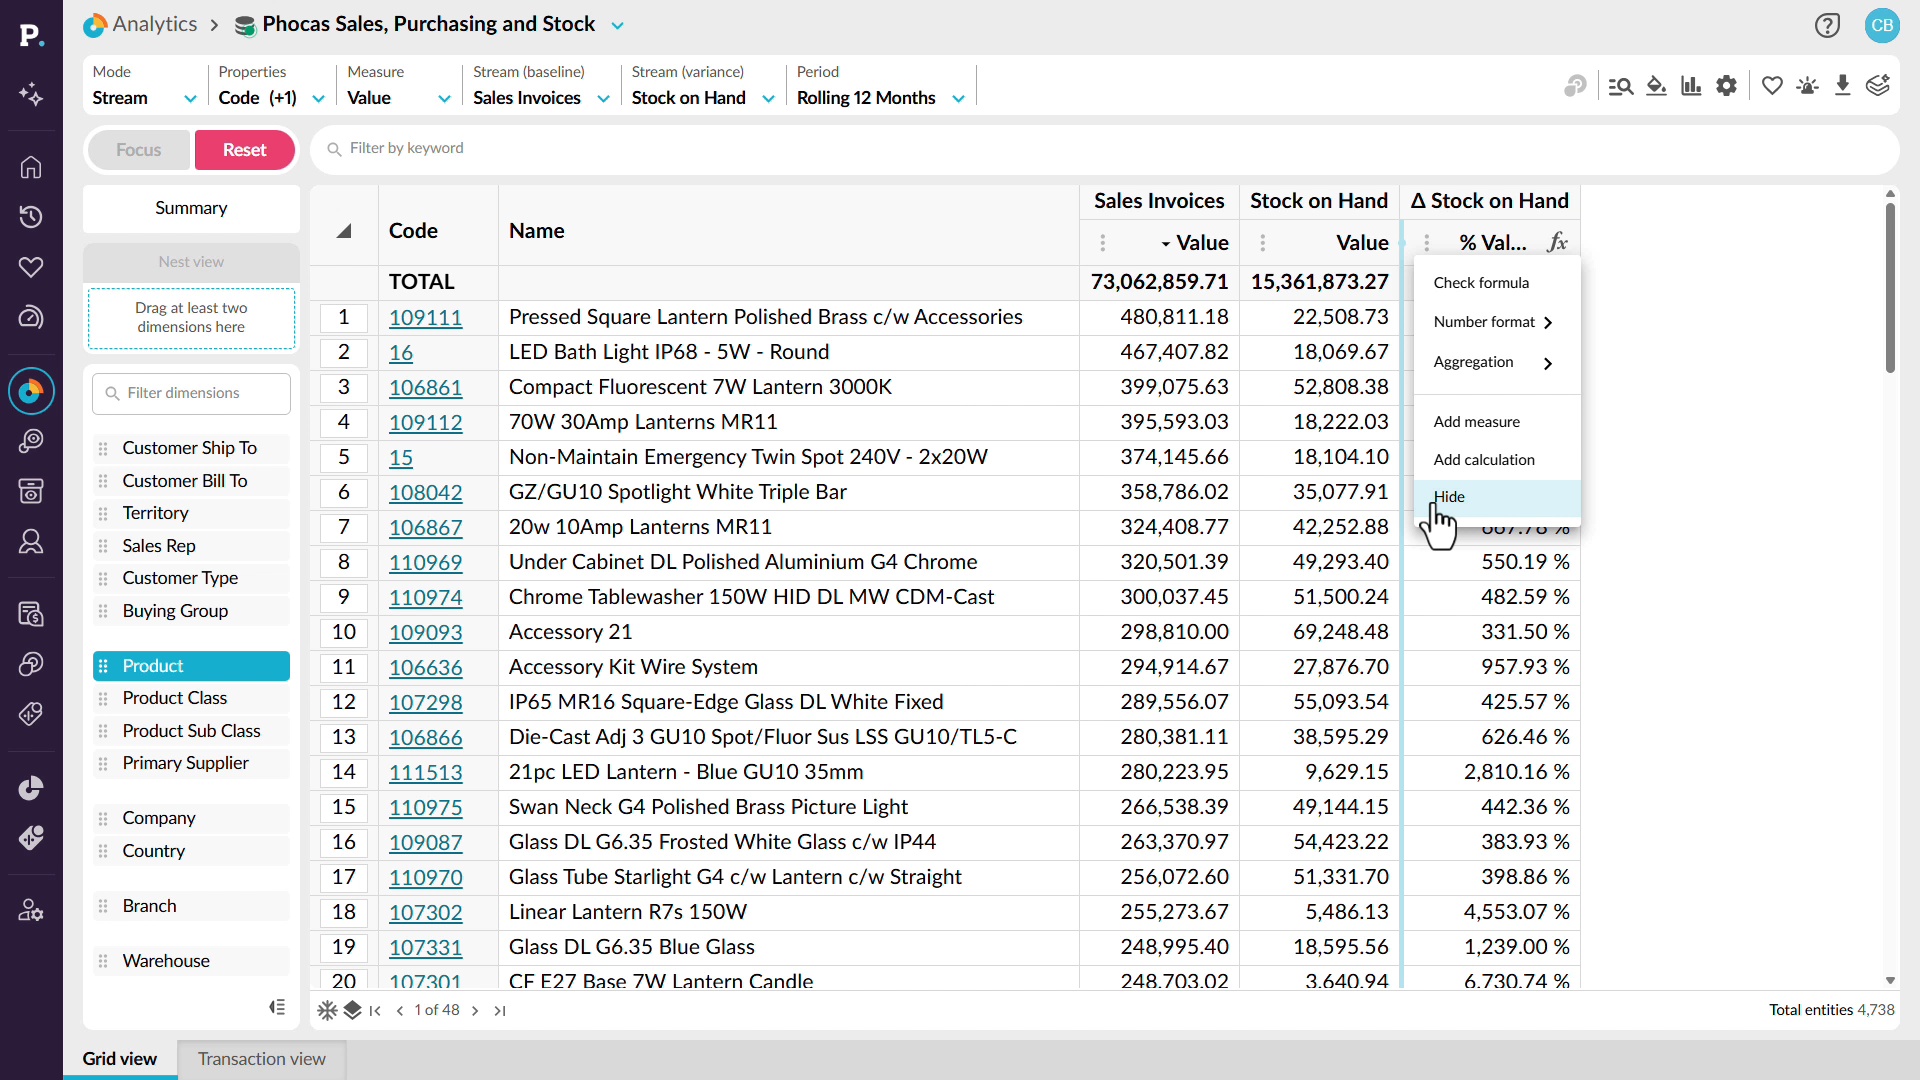
Identify dead stock and slow-moving inventory before it ties up more cash and warehouse space. See how to combine sales and stock information in the same analysis, then filter for products with no sales activity but stock still on hand. You can sort the results to find your biggest inventory concerns and save the analysis as a favorite, add it to a dashboard, or create an alert. You'll also see how to build custom inventory calculations using sales and stock measures, then compare results across different reporting periods. This gives you a clearer picture of stock movement and helps you make informed purchasing and inventory decisions.
 Analytics
Use alerts
Learn how to monitor important results with alerts. You'll set the metric and red, yellow, and green thresholds, choose when you're notified, and set up email delivery. You'll also test an alert before creating it, subscribe to shared alerts, and restore deleted alerts within 45 days.
 Analytics
Copy or export data
Learn how to take data out of the grid and use it elsewhere. You'll copy selected cells into Excel or Google Sheets, or export a wider set as CSV or XLSX. XLSX exports keep conditional formatting and nested rows, so your view carries across.
 Analytics
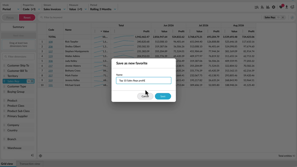
Save and share favorites
Learn how to save an analysis view as a favorite so you can return to it without setting everything up again. You'll see how to save, update, and delete favorites, share them with other users, save a copy as a new favorite, and subscribe to receive one by email on a schedule.
