Add a widget to a dashboard
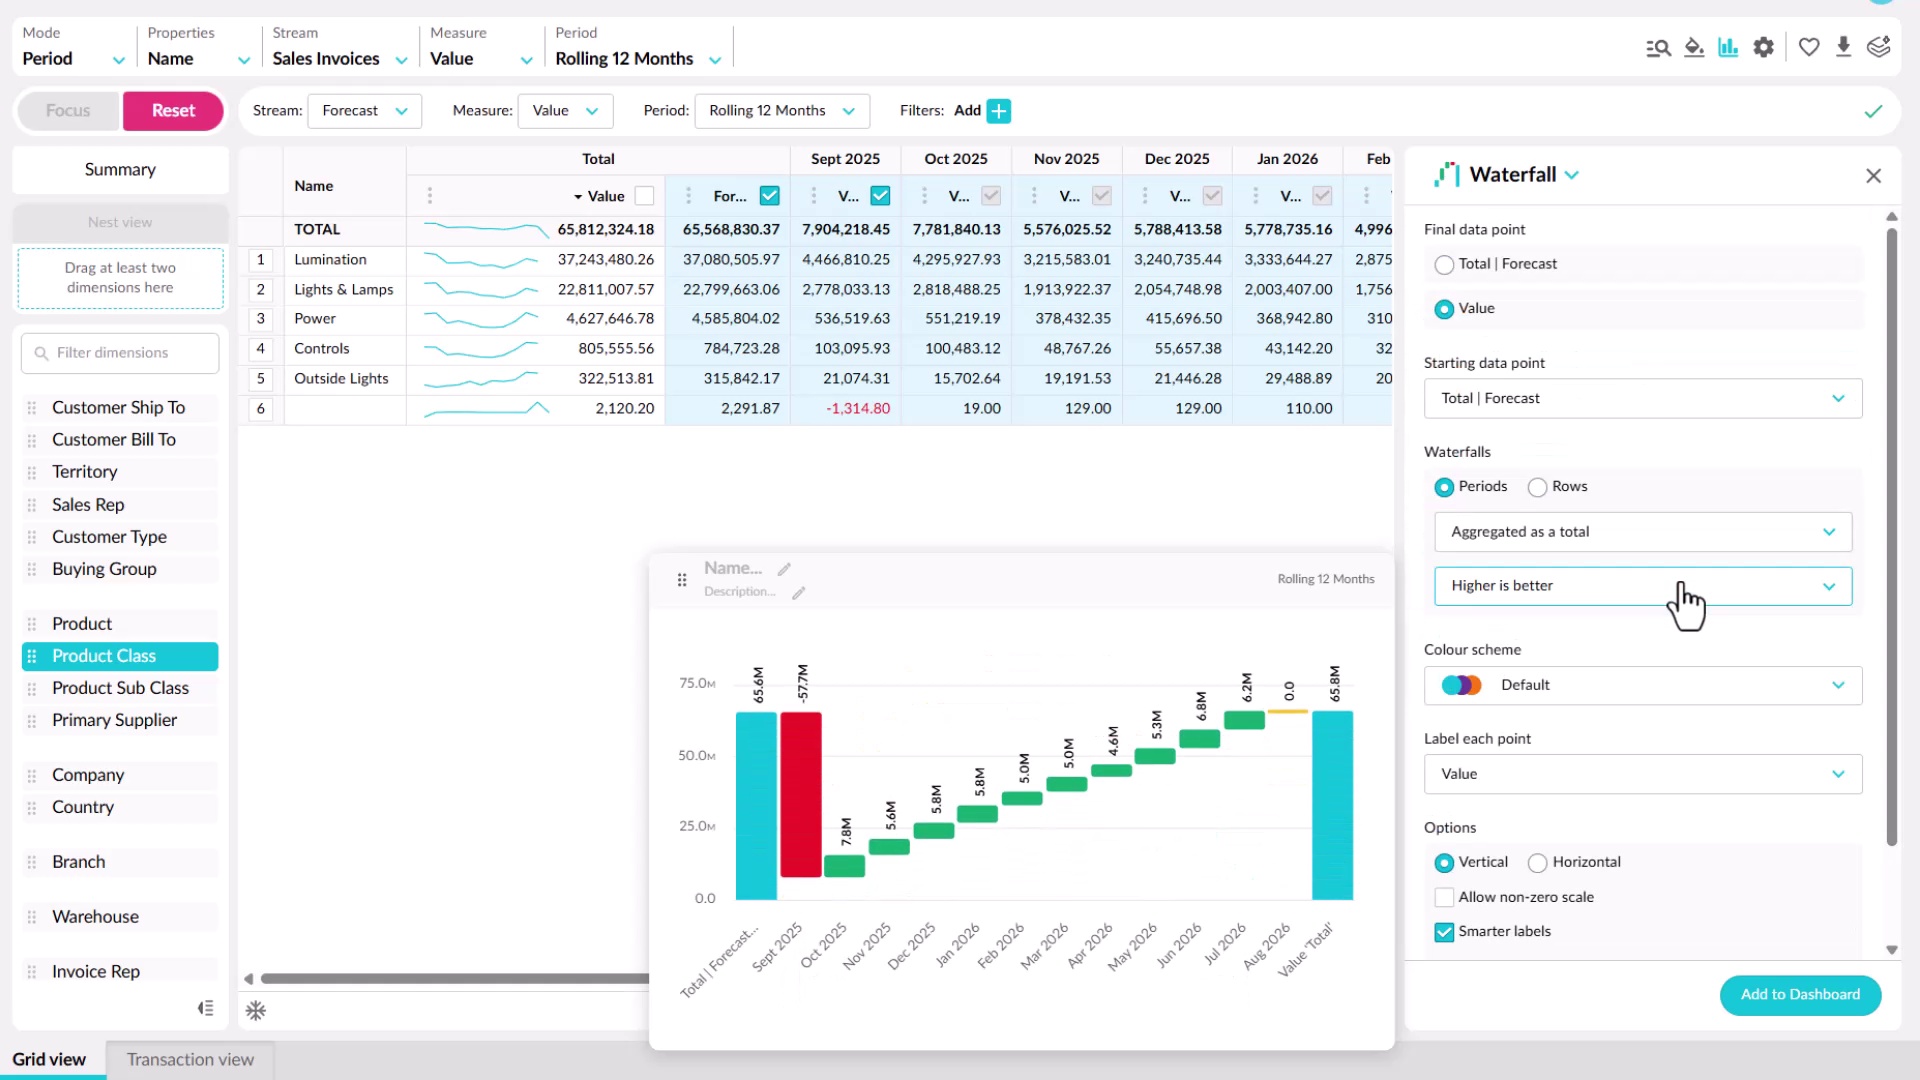
Learn how to add a widget from a dashboard or from Analytics or Financial Statements. You'll choose a chart type for what you want to show, such as bar, line, pie, value card, gauge, or waterfall, set options like colors and whether it responds to filters, then name it and add it to an existing or new dashboard.
Supporting documentation
 Dashboards

Related video tutorials
 Dashboards
Edit a dashboard
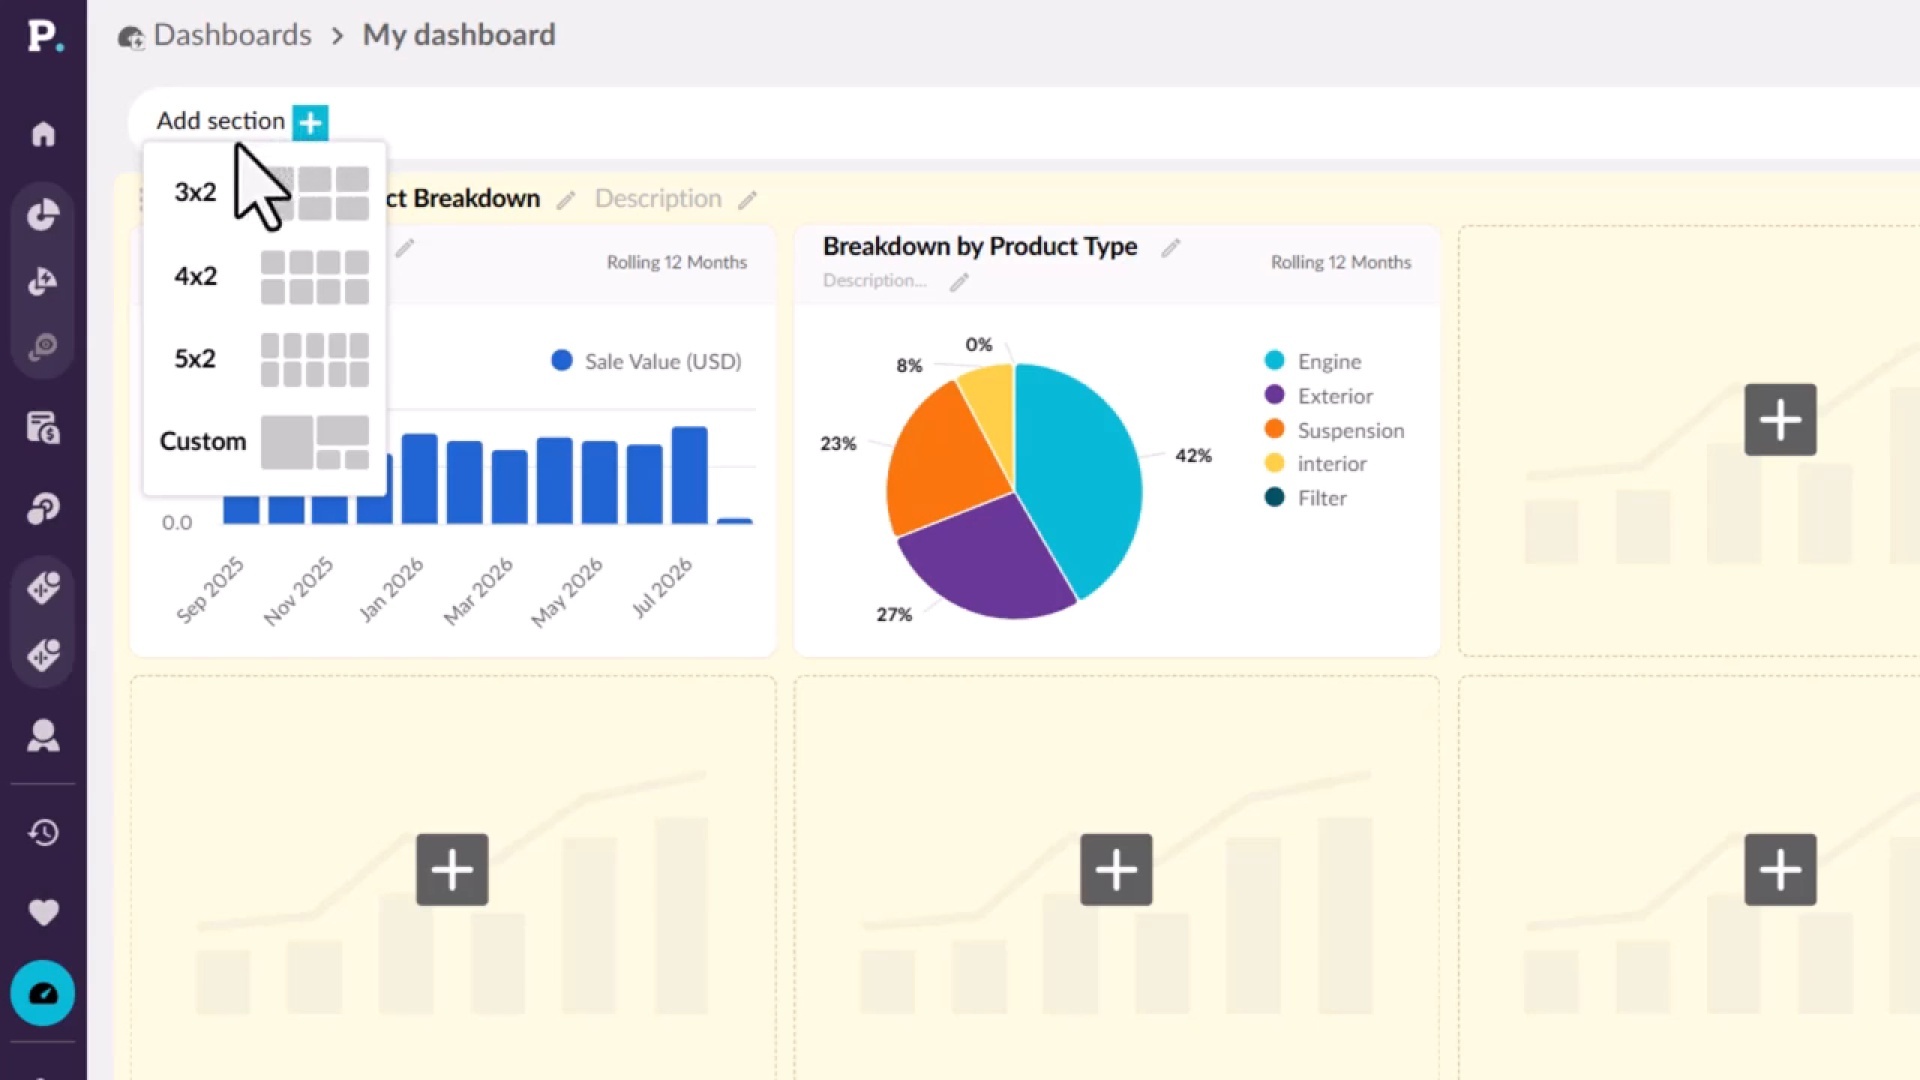
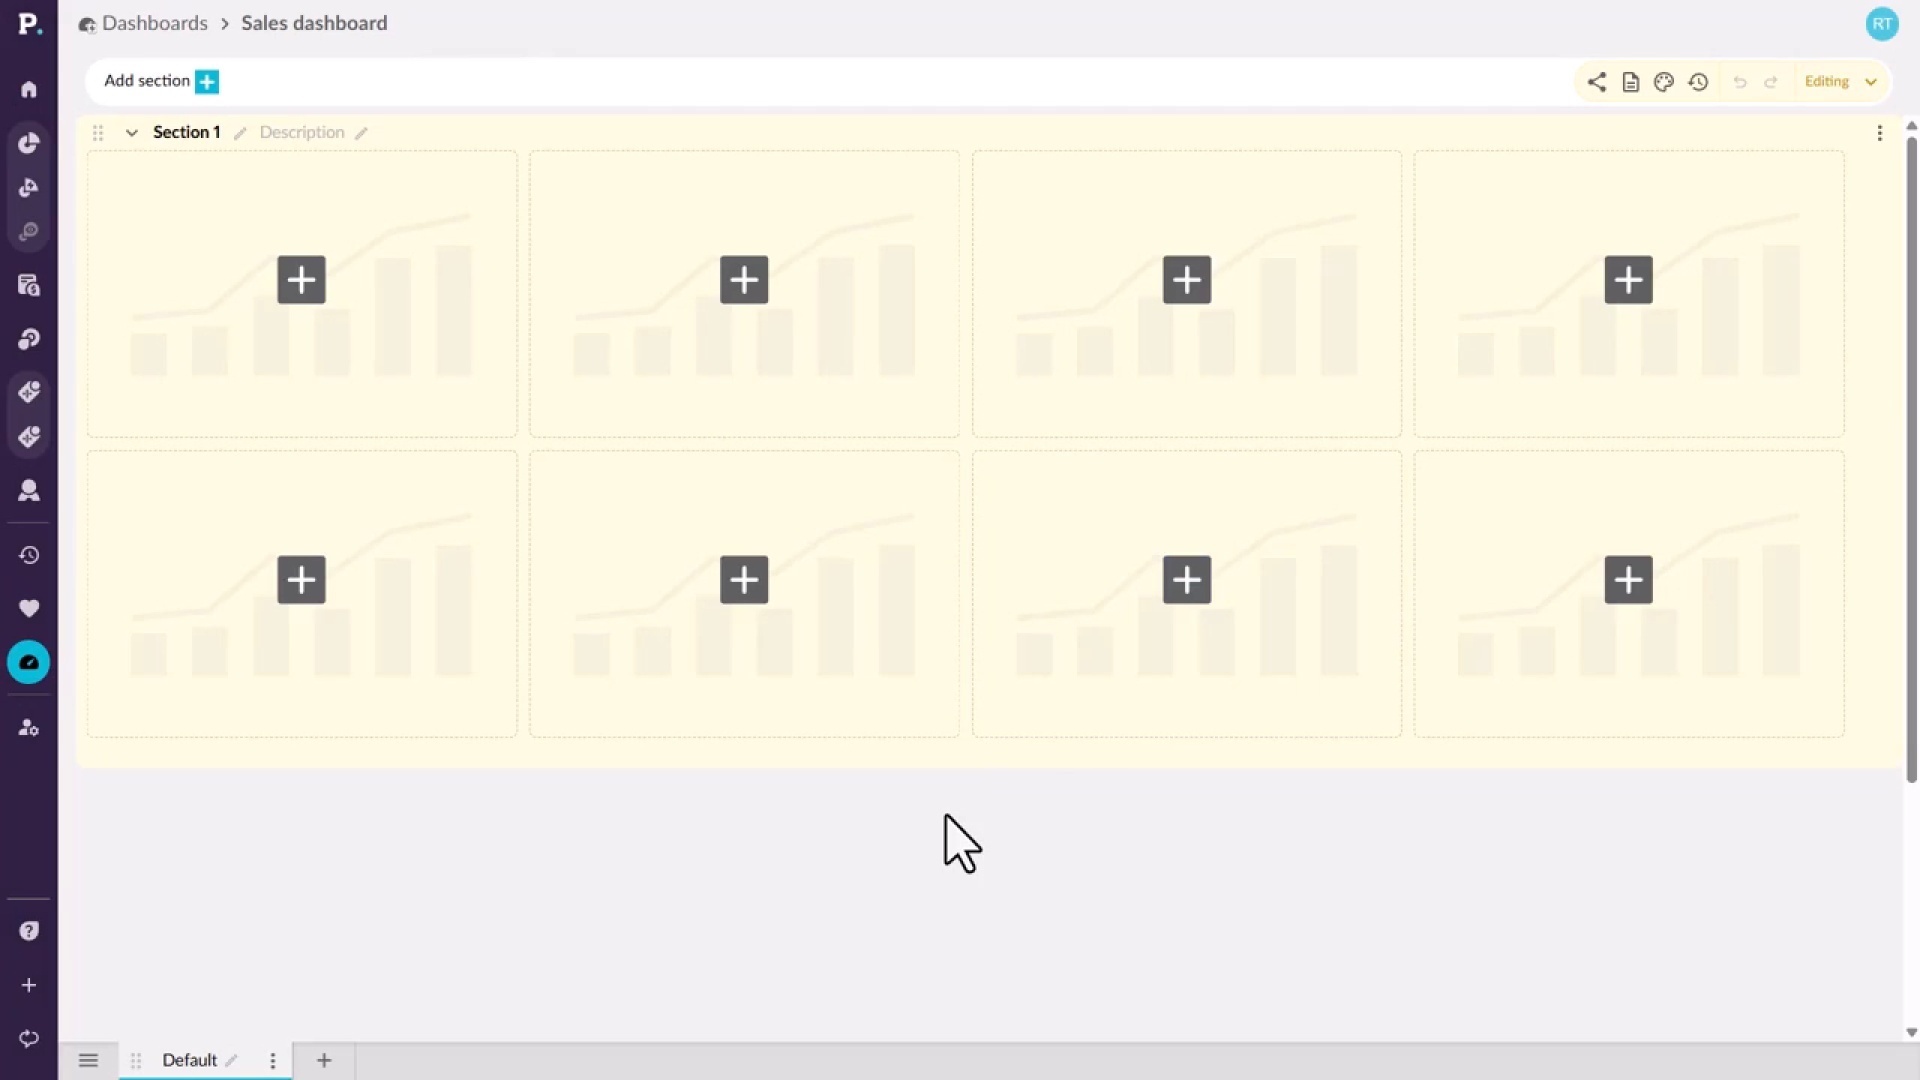
Learn how to shape a dashboard in edit mode, if you have permission to edit it. You'll add sections with preset or custom layouts, add and manage widgets, split a dashboard into tabs, and format its appearance. Your changes stay private until you publish them, and each publish saves a revision you can restore.
 Analytics (Classic)
Create KPI-style gauge, summary and bullet charts
Learn how to create KPI-style charts in chart view, including a gauge showing percentage variance against budget, a summary that counts declining customers, and a bullet chart comparing territories to the previous period. You'll set color ranges and conditions, then save the charts as favorites, set them as alerts, or add them to a dashboard.
 Dashboards
Filter your dashboard
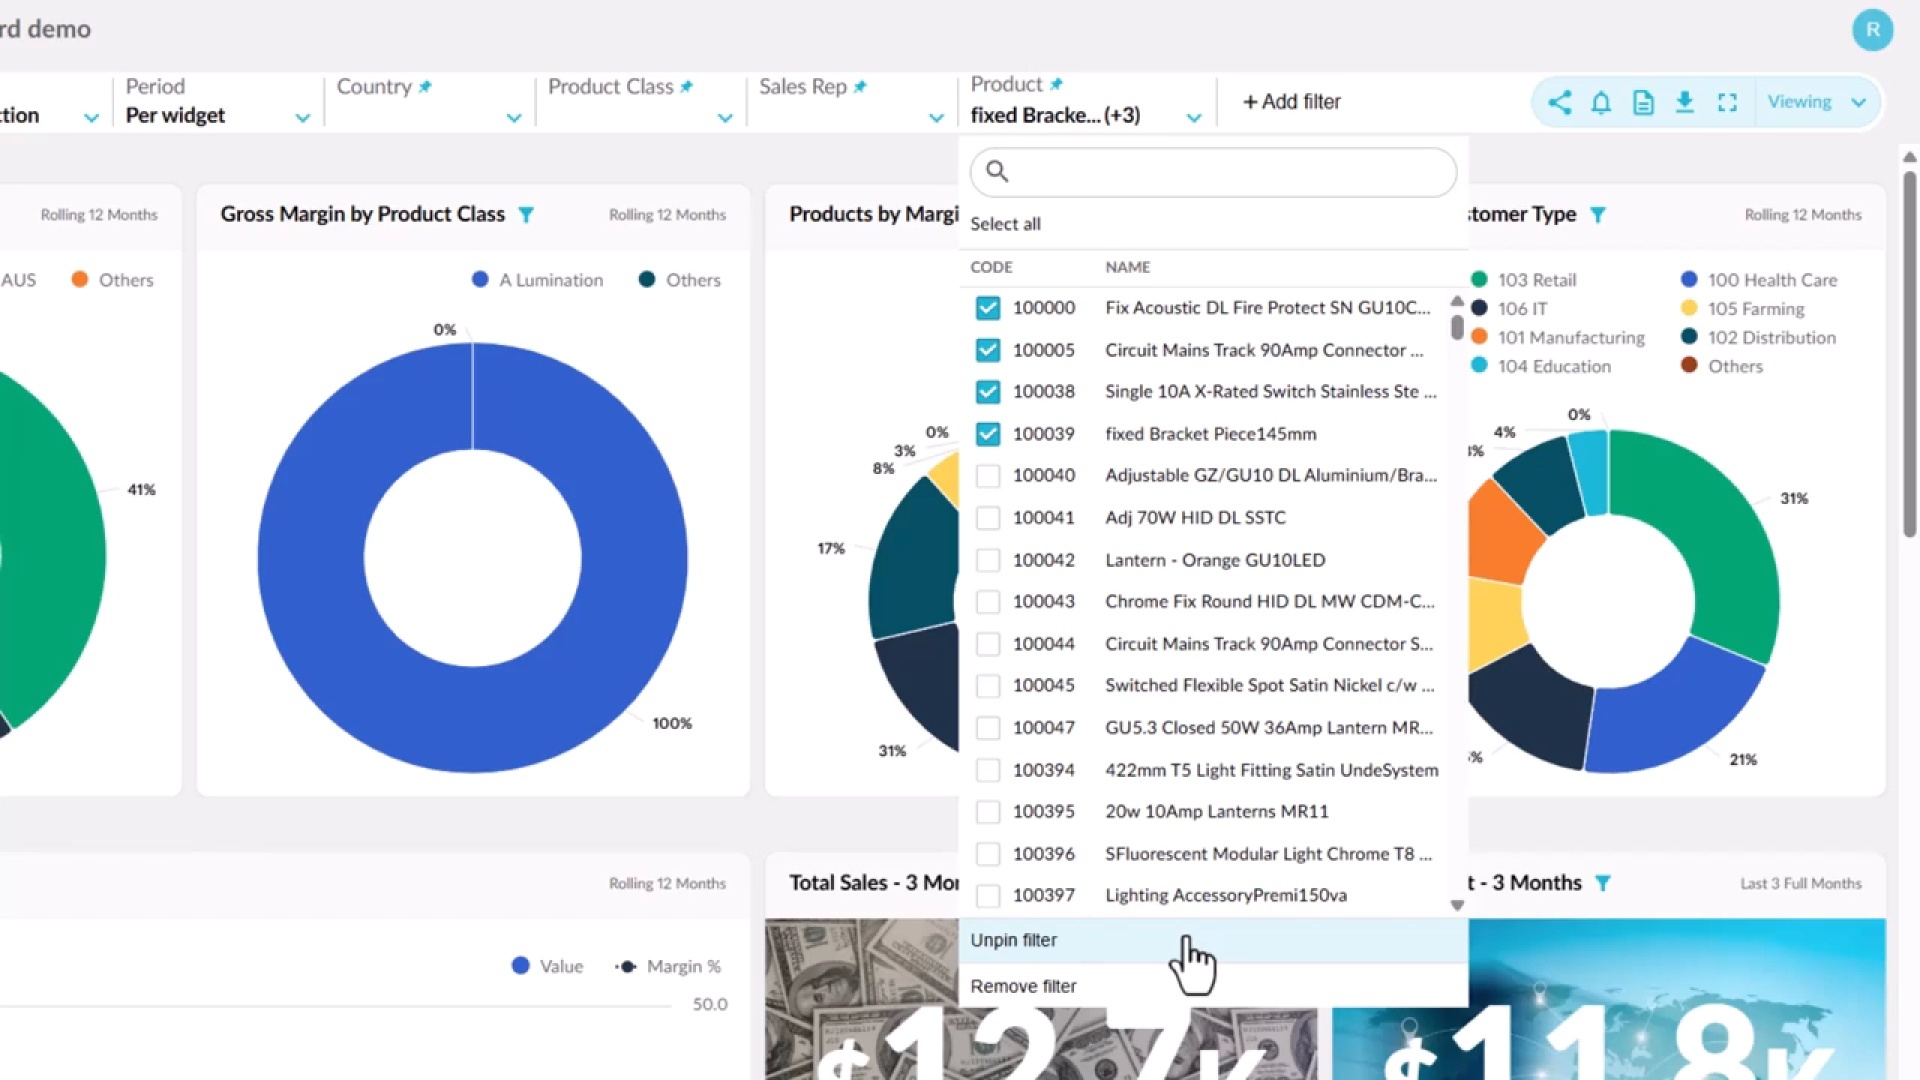
Learn how connected widgets highlight the same entity across a dashboard, and how Focus filters everything down to your selection. You'll add and pin your own filters, see which widgets respond to them, and apply a single period across every widget, then use Reset to return to the default view.
 Dashboards
Create a dashboard
Learn how to start a new dashboard from the Dashboards tab on the homepage or from the side navigation menu. You give it a name and an optional description, which appears under the name on the homepage, then create it and open it, ready to build.
