Use a dashboard
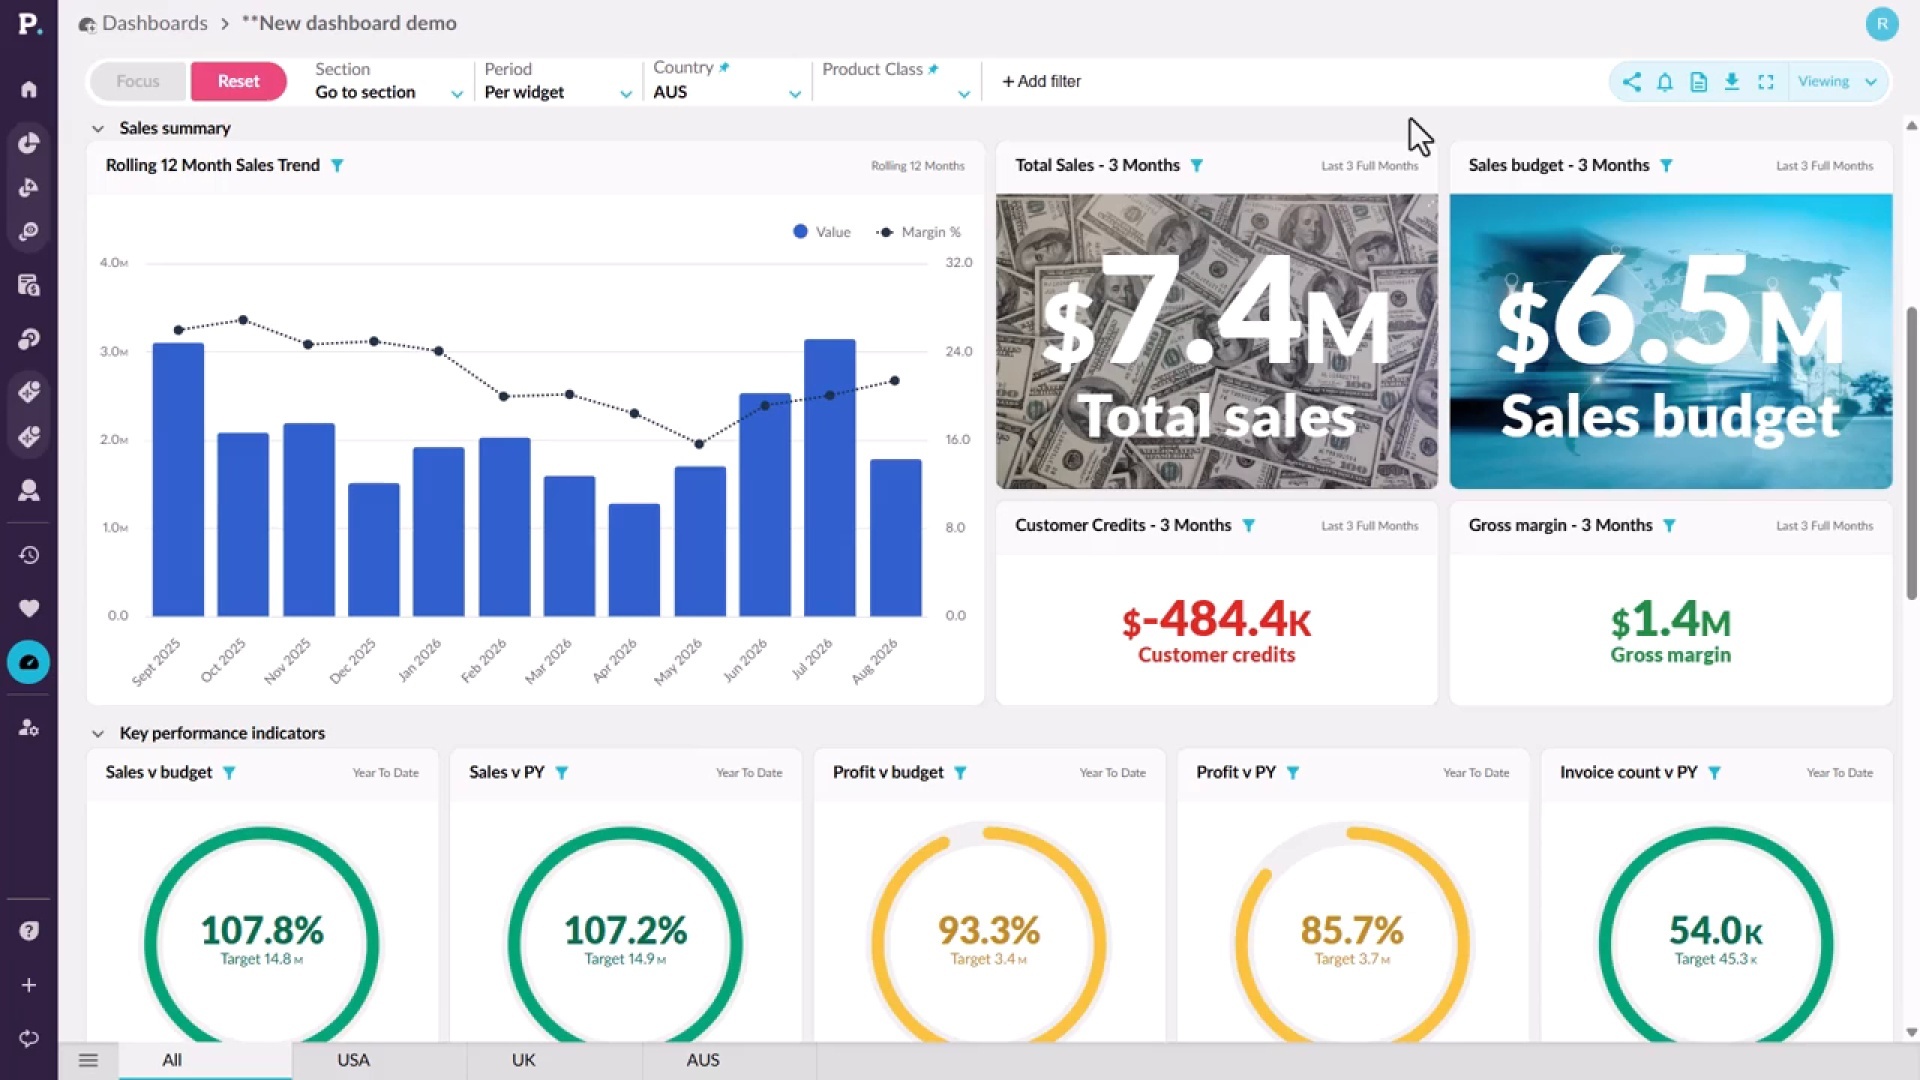
Learn how to find the dashboards you have access to and explore them. You'll select data in a chart and choose Focus to filter every widget, add and pin dropdown filters, apply one period across all widgets, and open a widget's data in the grid with Analyze. You can also share a dashboard, download it as a PDF, or view it full screen.
Supporting documentation
 Dashboards

Related video tutorials
 Dashboards
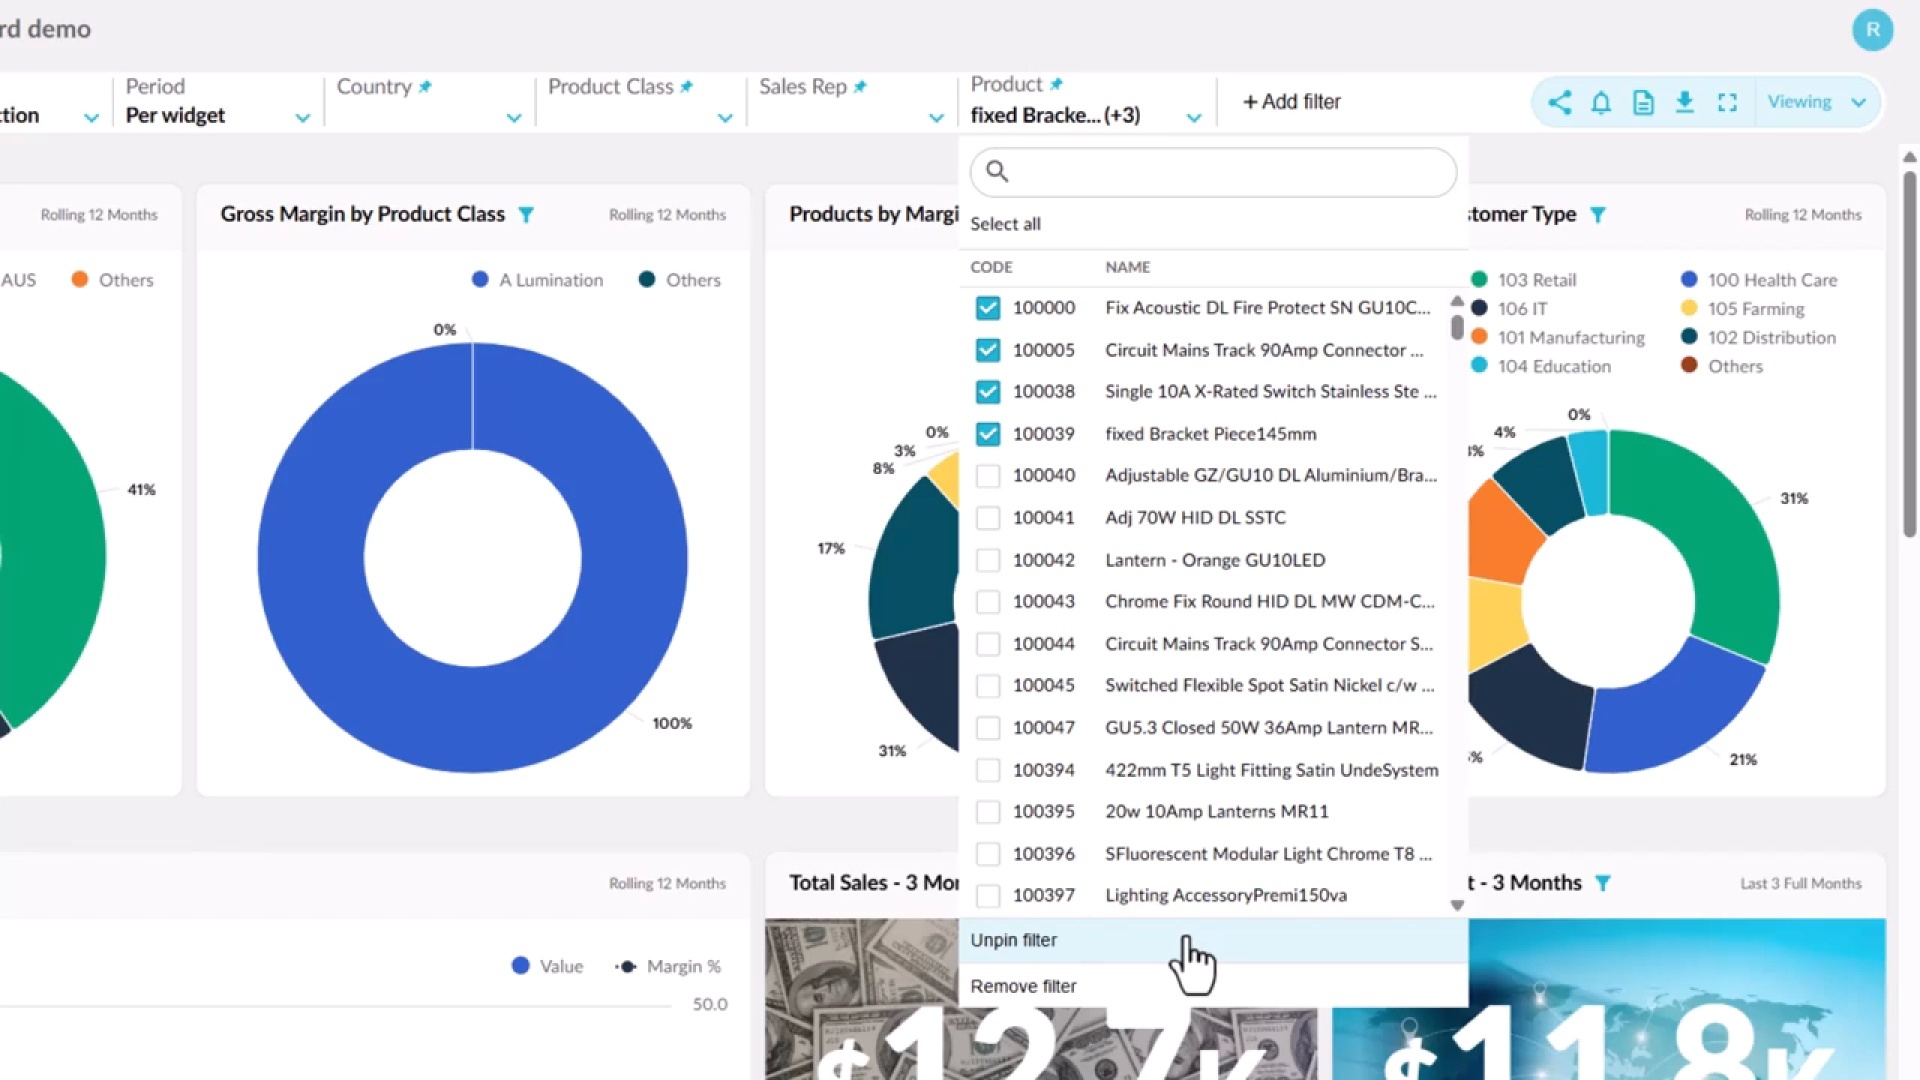
Filter your dashboard
Learn how connected widgets highlight the same entity across a dashboard, and how Focus filters everything down to your selection. You'll add and pin your own filters, see which widgets respond to them, and apply a single period across every widget, then use Reset to return to the default view.
 Platform
Use dashboards
Learn how to explore a dashboard by selecting data in a chart and choosing Focus to filter the view, then using Reset to return to the default. You also see how to open the underlying data in the Phocas Analytics grid with Analyze, set a home dashboard, and subscribe to dashboards to receive email updates at a time and frequency you choose.
 Analytics
Walk into the negotiation with receipts
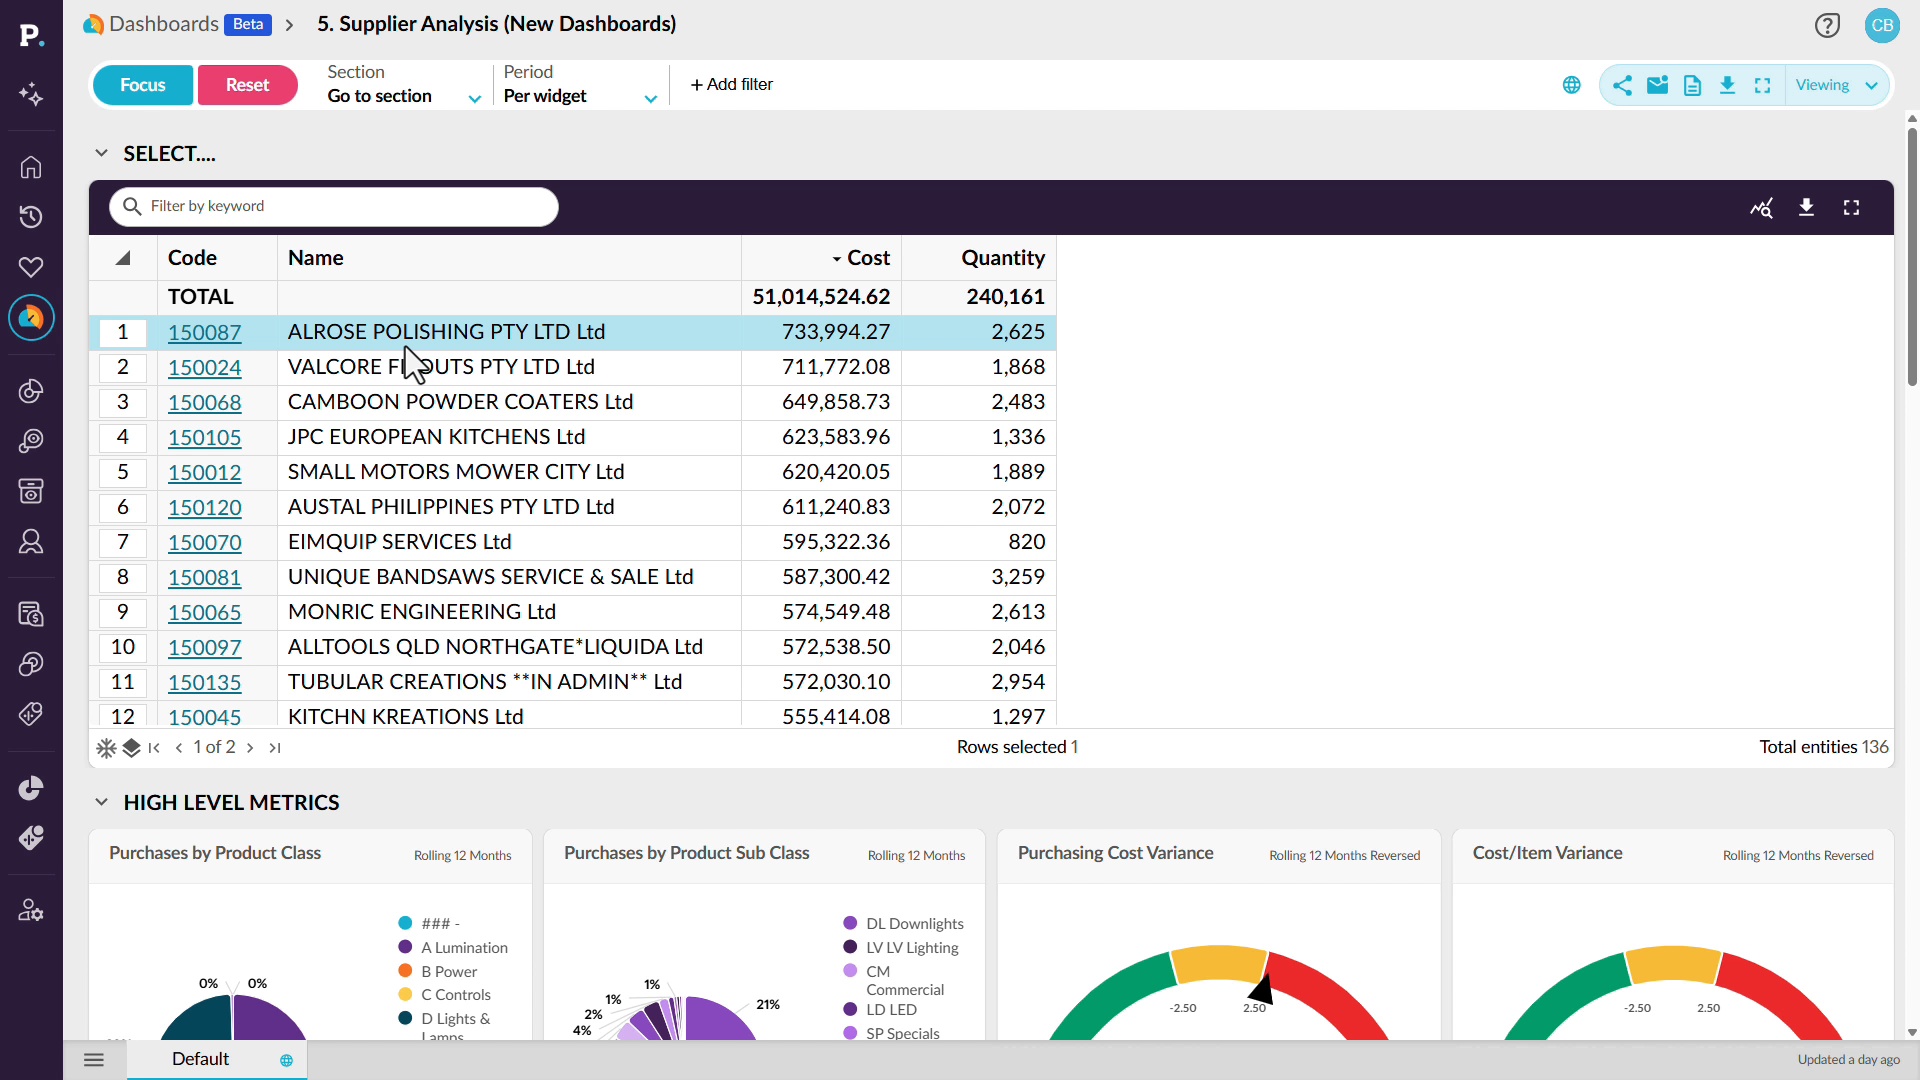
Learn how to go into supplier conversations with data on what you've spent and how each supplier has performed. You'll filter a supplier analysis dashboard to one supplier, review cost, open purchase orders, and price changes, then analyze a widget in its source data to see cost variances, trends, and individual purchase orders.
 Analytics
Walk in already briefed
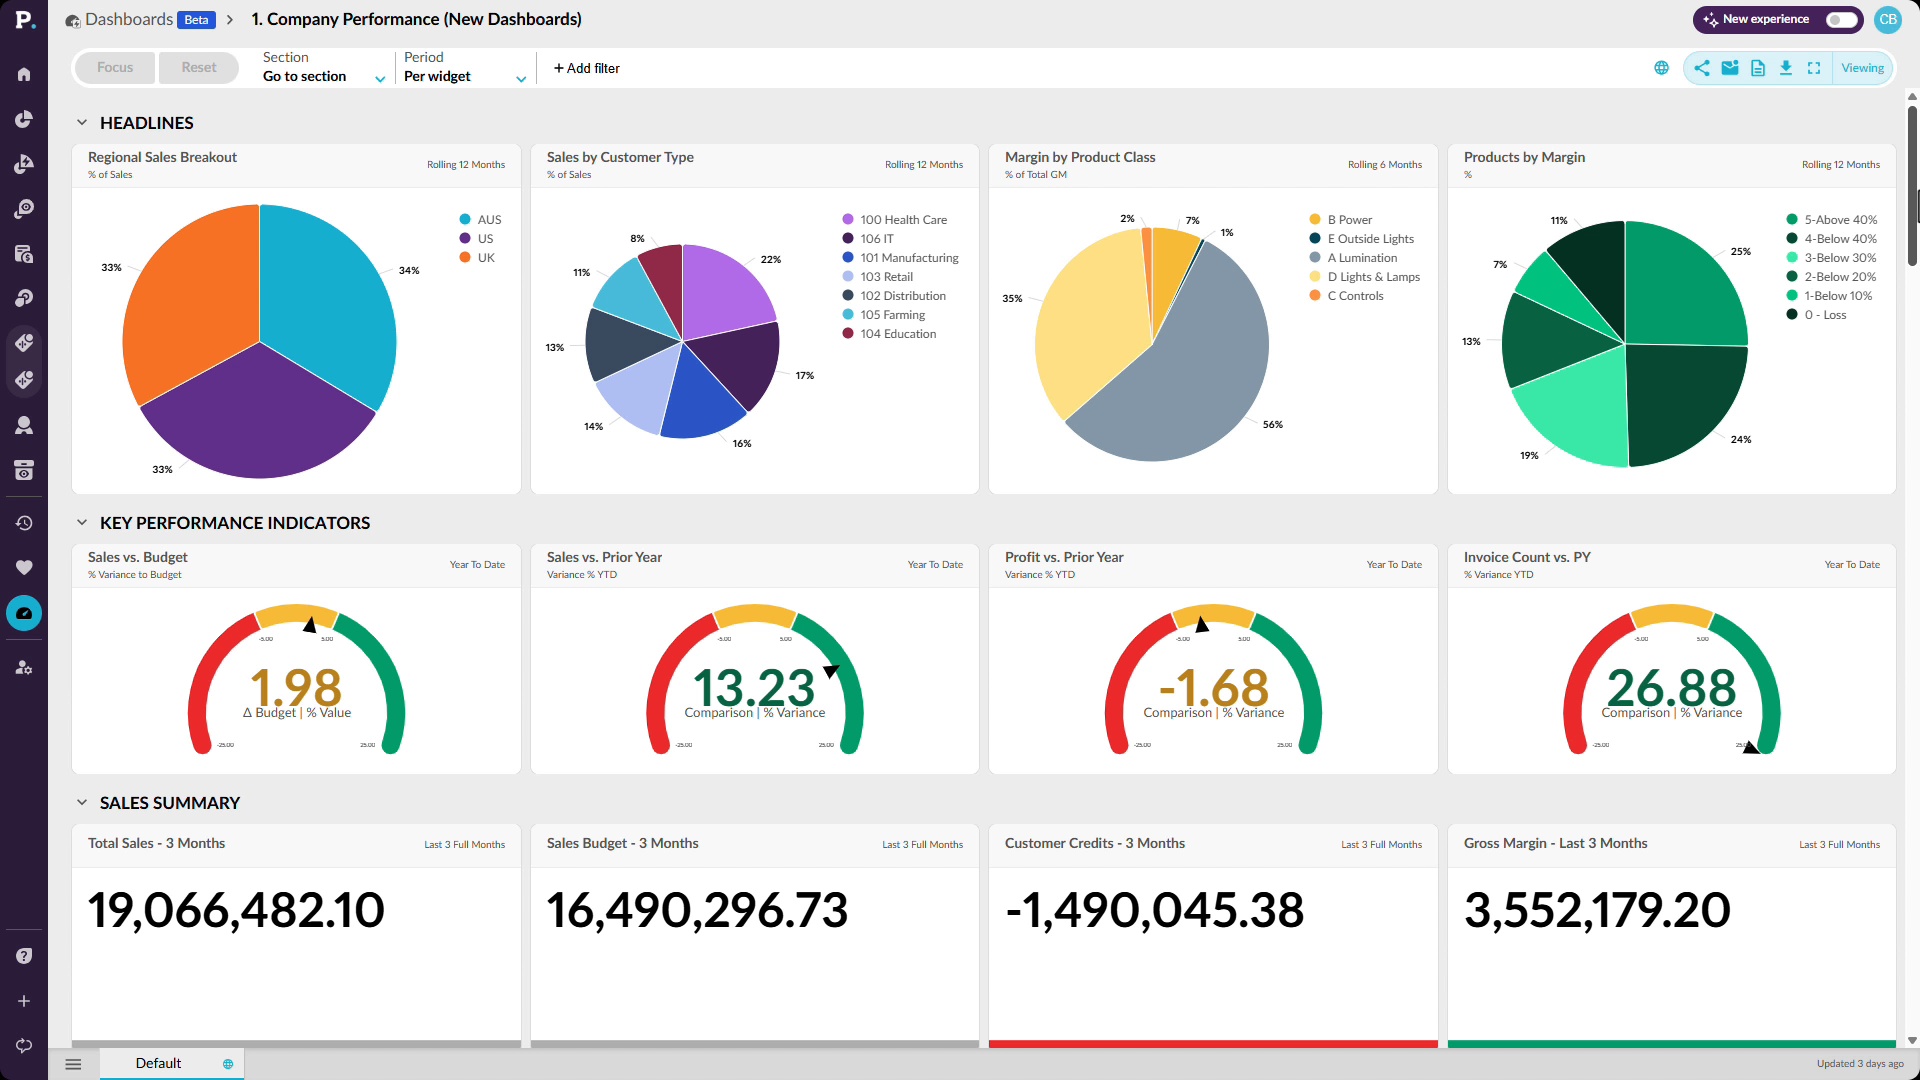
Learn how to prepare for a review by pulling the numbers yourself from live data. You'll use a company performance dashboard that brings sales, profitability, and finance KPIs together, focus it on a region, add filters such as product class, and drill into the data behind any concerning result.
