Reduce dead stock to protect margins and cash flow

Hidden inventory is costing you
Without real-time visibility into SKU-level data, dead stock is identified too late – and your options to recover the cost are already gone.
of distributors don't know their dead stock percentage at all
believe they are losing sales due to not having the right stock available
don't know their inventory days of supply – a basic metric for working capital control
review inventory performance daily, yet many still rely on static spreadsheets
It pays to get this inventory metric right
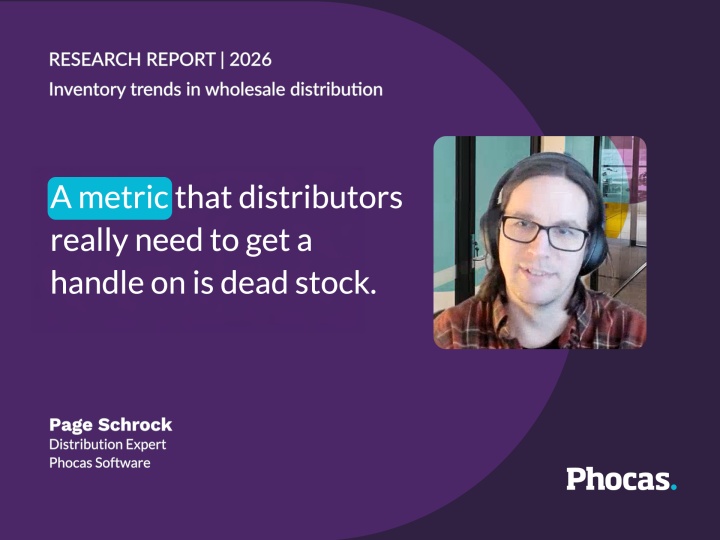
With 20 years in wholesale distribution, Page Schrock knows where to start when inventory data feels overwhelming. His answer: dead stock. Get a handle on it and everything else tends to follow.
Prevent dead stock before it impacts profitability
Phocas Analytics helps you understand exactly what's happening across your inventory – from every angle. Using live ERP data to spot risk early, evaluate performance at SKU level, and act before slow-moving stock erodes profit.
- Surface slow movers early: Filter by last sale, stock age and turn rate to find underperforming SKUs before they become write-offs.
- Segment by risk level: Spot products moving toward dead stock status while you still have cost-effective options to act on.
- Calculate the true carrying cost: Understand what it is actually costing you in capital, storage and future discounting pressure.
- Test pricing strategies: See the margin impact of discounting on slow movers before applying it.
- Track financial impact over time: Measure dead stock as a percentage of total inventory each month.
Dead stock benchmarks
Response
- No dead stock
1% - Less than 2% dead stock
19% - 2-5% dead stock
20% - 6-10% dead stock
26% - 11-15%
9% - More than 20% dead stock
3% - Don't know
22%
Evaluation
- No dead stock
Very rare. Almost all distributors carry at least some dead stock each year - Less than 2% dead stock
Indicates strong inventory discipline and data-driven product lifecycle management. - 2-5% dead stock
A common and relatively healthy operating range, reflecting manageable levels of stock obsolescence. - 6-10% dead stock
The largest group. At this level, dead stock becomes a cash flow and storage space issue. - 11-15%
Can signal inventory risk and weaker alignment with internal teams and customer preferences. - More than 20% dead stock
Indicates structural inventory management issues. - Don't know
A significant proportion of distributors cannot quantify dead stock, highlighting inventory visibility and measurement gaps.
| Dead stock per year | Response | Evaluation |
|---|---|---|
| No dead stock | 1% | Very rare. Almost all distributors carry at least some dead stock each year |
| Less than 2% dead stock | 19% | Indicates strong inventory discipline and data-driven product lifecycle management. |
| 2-5% dead stock | 20% | A common and relatively healthy operating range, reflecting manageable levels of stock obsolescence. |
| 6-10% dead stock | 26% | The largest group. At this level, dead stock becomes a cash flow and storage space issue. |
| 11-15% | 9% | Can signal inventory risk and weaker alignment with internal teams and customer preferences. |
| More than 20% dead stock | 3% | Indicates structural inventory management issues. |
| Don't know | 22% | A significant proportion of distributors cannot quantify dead stock, highlighting inventory visibility and measurement gaps. |
| Talk to an expert |
Dead stock: a demand planning problem in disguise
Most dead stock doesn't appear overnight – it builds up when purchasing decisions are made on historical data that no longer reflects real demand. When sales forecasts, stock levels and purchasing plans live in separate systems, slow movers go undetected until they're already a write-off. Getting demand planning right is how you stop the problem at the source rather than managing the consequences.
Phocas Budgets & Forecasts connects your sales forecasts, current stock on hand and purchasing data into a single demand plan – so your team can see projected stock levels by supplier, product class or SKU, period by period.
Customer quote
What to do with slow moving stock
Even with the best planning, some stock will age. The key is having options – and knowing which one applies while you still have time. Here's the sequence most distributors use, in order of margin recovery.
For stock still within return terms, this is the highest-recovery option. It only works if you can see aging inventory early enough to act. Phocas surfaces those SKUs while return windows are still open, not after they've lapsed.
A clearance event applied without margin analysis often clears the stock and damages category pricing at the same time. Phocas lets you model the impact before you commit, so the decision is deliberate rather than reactive.
Pairing a slow mover with a fast-moving product can clear excess stock without a headline discount or a price signal to the market. Phocas gives you the velocity data to identify natural bundle pairs by product class or supplier category.
When clearance isn't viable, Phocas Financial Statements allows you to track write-offs as they flow through your profit & loss and balance sheet – so the impact is visible and accounted for, not hidden until the next board meeting.
The cheapest fix is not creating more dead stock in the first place. Phocas Budgets & Forecasts lets your purchasing team factor actual clearance activity and adjusted demand into forward purchasing plans – so you're not ordering into inventory that's already aging.
See what's selling, know what to buy
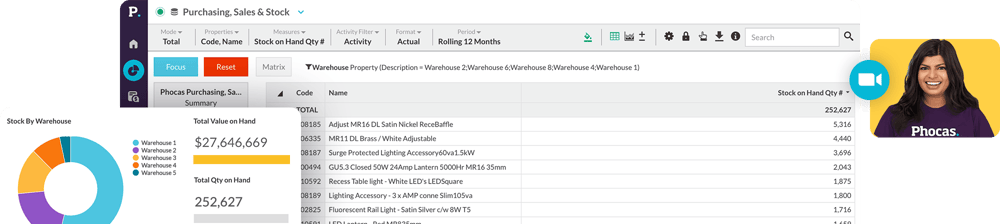
- View rolling 12-month sales alongside current stock on hand by product and location
- Calculate months cover instantly to know exactly how long your current stock will last
- Spot which products, categories or warehouses need attention before stock runs out
- Automate complex inventory calculations in a few clicks – no spreadsheets needed
- Give purchasing and finance shared, real-time visibility for confident stock decisions
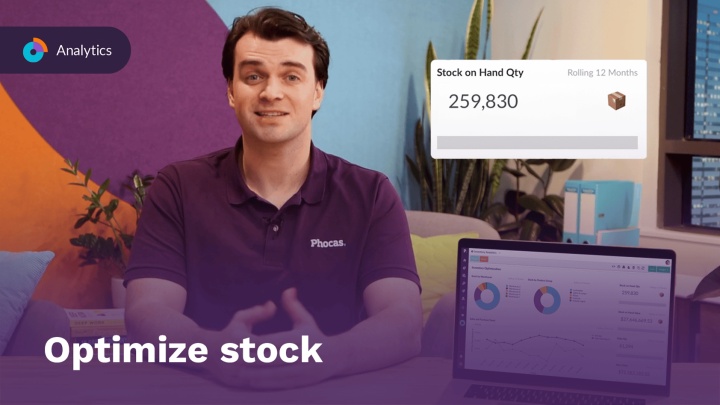
Smart inventory management
"Phocas has helped us to analyze stock that isn't moving or is moving slowly, so we can move stock around to make the best use of it. This also helps us ensure our suppliers are stocking the right products for us or to plan our deliveries proportionately."
— Mark Law, IT Director at Hayley Group.
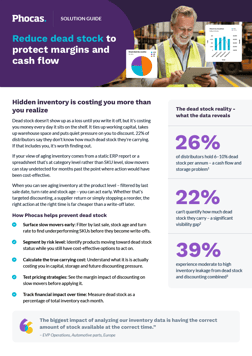
Connected inventory visibility across your business
Reducing dead stock depends on visibility you can trust. Phocas connects to your existing ERP and surfaces aging inventory, slow movers and stock risk in one connected view – giving your purchasing, finance and operations teams the shared picture they need to act.
Inventory trends in wholesale distribution
If products and supply chains are part of your working day – this new trends report is a must read.
Frequently asked questions
Demand planning software forecasts demand for all of your products based on consolidated data, seasonality, promotions and customer behaviour. The primary goal of demand planning software is to help businesses optimize inventory levels, streamline production schedules, and ensure sufficient stock availability to meet customer needs while minimizing excess inventory and tying up cashflow.
When selecting demand planning software it is essential to consider how the platform can access and store data. The more detail you can forecast to like by sales value, sales cost, stock availability and number of invoices the better the accuracy. Ensure the software can accept supply chain management information from the warehouse and beyond as well as pertinent information from your ERP as well as be able to customize the databases to support your business nuances.
Effective demand planning often requires input from multiple stakeholders across different departments. Look for software that facilitates collaboration by enabling teams to share data, insights, and feedback in real-time.
The software should provide powerful analytics and reporting capabilities to track forecast accuracy, monitor key performance indicators (KPIs),and identify trends and patterns in demand data. Look for customizable dashboards and real-time insights to support data-driven decision-making.
Demand planning and demand forecasting are closely related concepts in business operations and supply chain management, but they serve different purposes and involve distinct processes.
Demand forecasting involves predicting future customer demand for a product or service based on historical data, market trends, seasonality, and current conditions. Demand planning involves translating demand forecasts into plans and strategies to ensure that the right products are available in the right quantities at the right time.
Yes, many software solutions are designed to handle both inventory management and demand forecasting within a single integrated platform. These types of software offer features to help businesses optimize their inventory levels while accurately predicting future demand. Look out for platforms that offer Artificial Intelligence capability, multiple system and data integration plus reporting and analytics.
The Phocas platform integrates data from various sources, including historical sales data, inventory levels, customer orders and market trends to facilitate both inventory management and demand forecasting processes. Phocas includes advanced forecasting algorithms and models to generate accurate demand forecasts. Planners can adjust parameters and perform scenario analysis to improve forecast accuracy.
Understand the past, operate better today, and plan well for the future